100% in 2 Months(w/ P&L) — The Double Bottom / Double Top Story
By Harsh Shah · Updated
Disclaimer: This was a textbook technical setup. It doesn’t mean every trade will play out this way.
Technical analysis didn’t predict the future — but it helped identify a high-probability opportunity, manage emotions, and create a structured plan.
In this trade, I entered near the bottom and sold into strength for a 106% gain.

No, this doesn’t happen every day.
But technical analysis helps you stay rational — buying when fear is high and taking profits when excitement takes over.
Let me break this one down.
April 10th — the market offered a second chance.
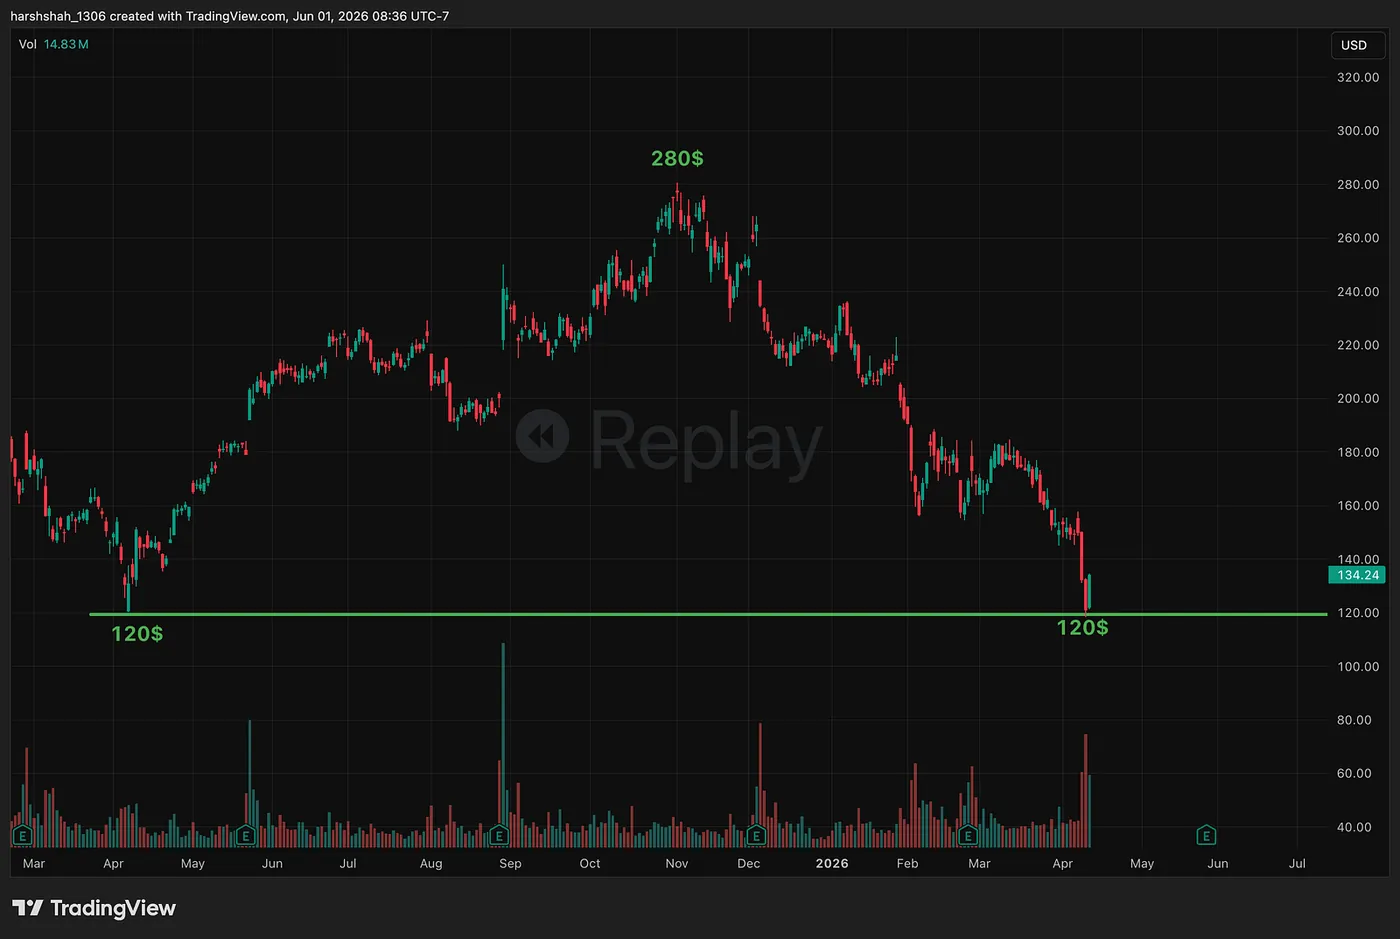
Imagine a stock trading at $120.
You watch it run all the way to $280, and suddenly regret not buying.
Now imagine the market gives you another opportunity.
The stock falls from $280… back to $120.
That’s exactly what happened here.
This is what traders call a Double Bottom pattern.
Why? Because many people who missed buying near $120 the first time are waiting for another shot. When price revisits that level, buyers often step in aggressively, creating a strong support zone.
Fortunately, this stock was already on my radar, and I initiated my position right around that level.
June 1st: The Double Top — Selling Into Strength
Now flip the perspective.
Imagine you bought near $280, only to watch the stock collapse to $120.
If price eventually rallies back to $280, would you sell?
Many people would.
And that’s exactly what creates a Double Top.
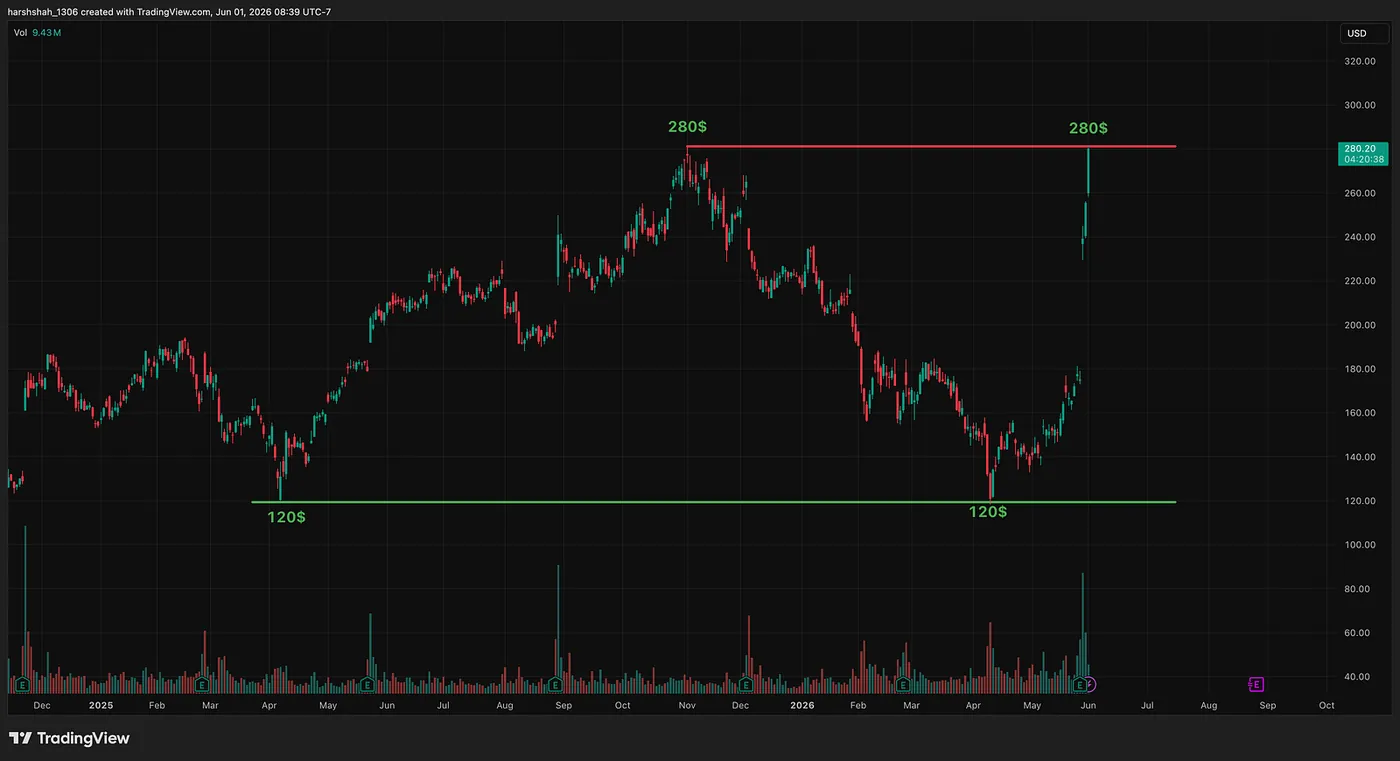
As the stock returned to prior highs, sellers emerged, momentum slowed, and I used that strength to exit the position.
Not every technical setup plays out this cleanly.
But the goal isn’t perfection.
The goal is consistency — following setups with favorable risk/reward and allowing probabilities to work in your favor over time.
Final Thoughts
If you want to improve your technical analysis skills, my course is a great place to start. I’ve compiled the methods I use and the lessons I’ve learned over the last decade into one place — so you can accelerate your learning curve and get ahead in your investing journey.
I’ve intentionally kept it affordable because my goal isn’t to maximize income from education — it’s to help more people understand markets, build confidence, and develop a skill that lasts a lifetime.
I truly believe investing in market education is one of the highest-ROI skills you can develop.
And as always, I’ll continue sharing charts and setups for free:
📈 Charts: datadriveninvesting.io/charts
📷 Instagram: @datadriveninvesting