A deep dive into the 55% collapse — and how the chart saw it coming…
By Harsh Shah · Updated
Disclaimer: This article is for educational purposes only and should not be considered financial advice.
Snowflake Inc. is down 55% in the last 4 months.
But that’s not the real story.
The real story?
This drop was visible before it happened.
Level by level. Candle by candle.
This is exactly why technical analysis matters.
It helps you:
- Stay out when risk is high
- Exit before the damage
- Control emotions when the market gets noisy
Let’s break it down.
New to TA ? Here is the full roadmap for you to get started [FREE]
Want something structured ? My course will help you to get started.
Before we proceed, read more about:
Master these first — everything else builds on top.
November 3 — The Decision Point
Price: $277
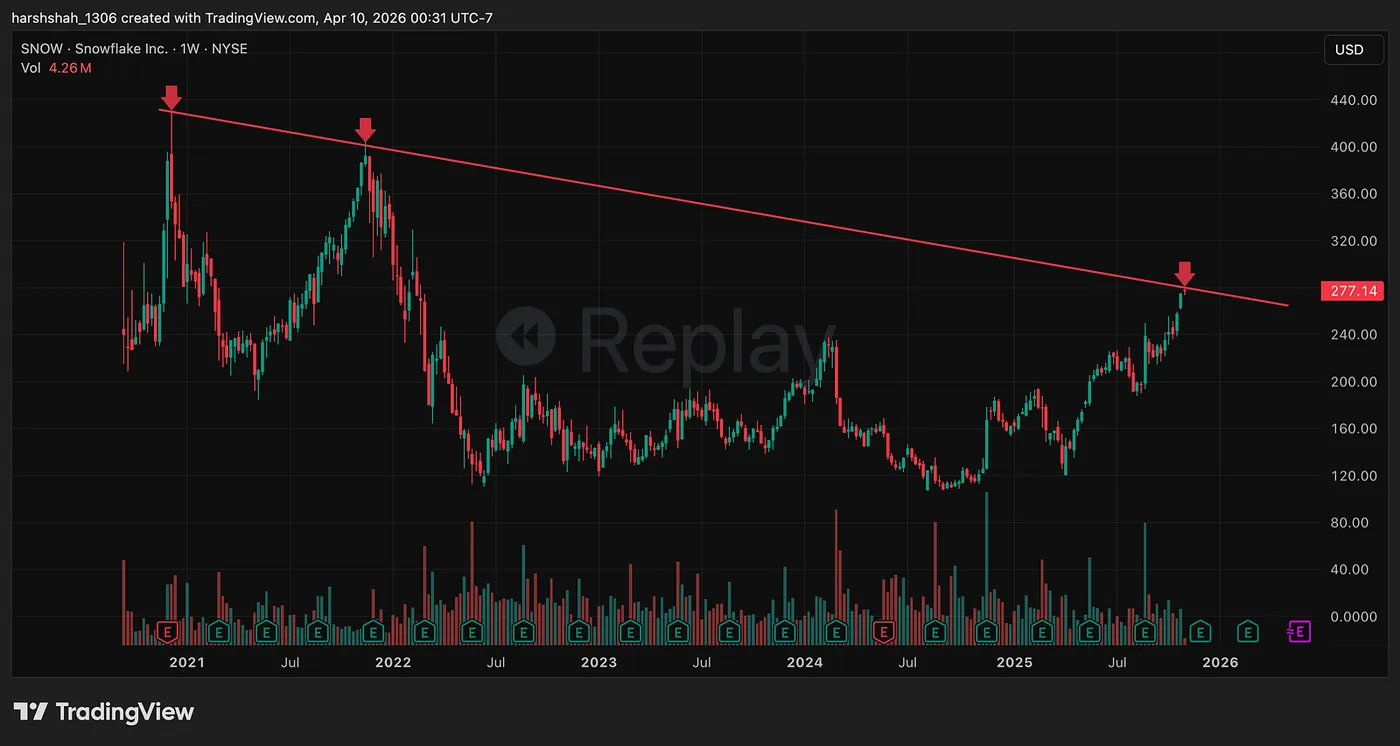
Snowflake ran straight into a multi-year resistance around 277.
This was not just another level.
This was a make-or-break zone.
At this point, there are only two possibilities:
- Breakout → continuation
- Rejection → reversal
No guessing needed.
The only job? Wait and watch price action.
January 5 — The Early Warning
This is where most traders get trapped.
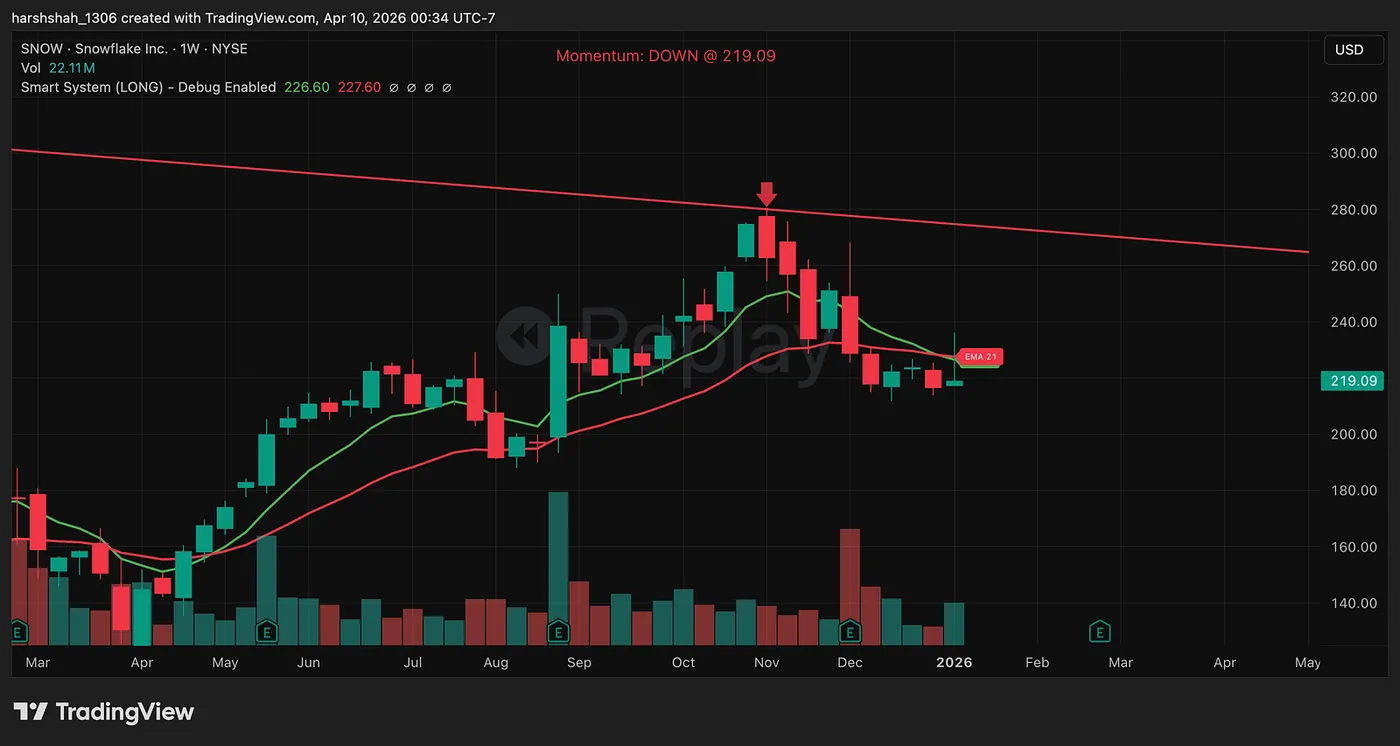
The 8 EMA(green) crossed below the 21 EMA(red).
That’s your shift:
- Momentum turns bearish
- Buyers lose control
- Structure starts weakening
At the same time:
- Price failed to break highs
- Rejection confirmed
This wasn’t noise.
This was the market telling you: trend is changing.
April 10 — Where We Are Now
Price is now approaching a key support zone: $110–120.
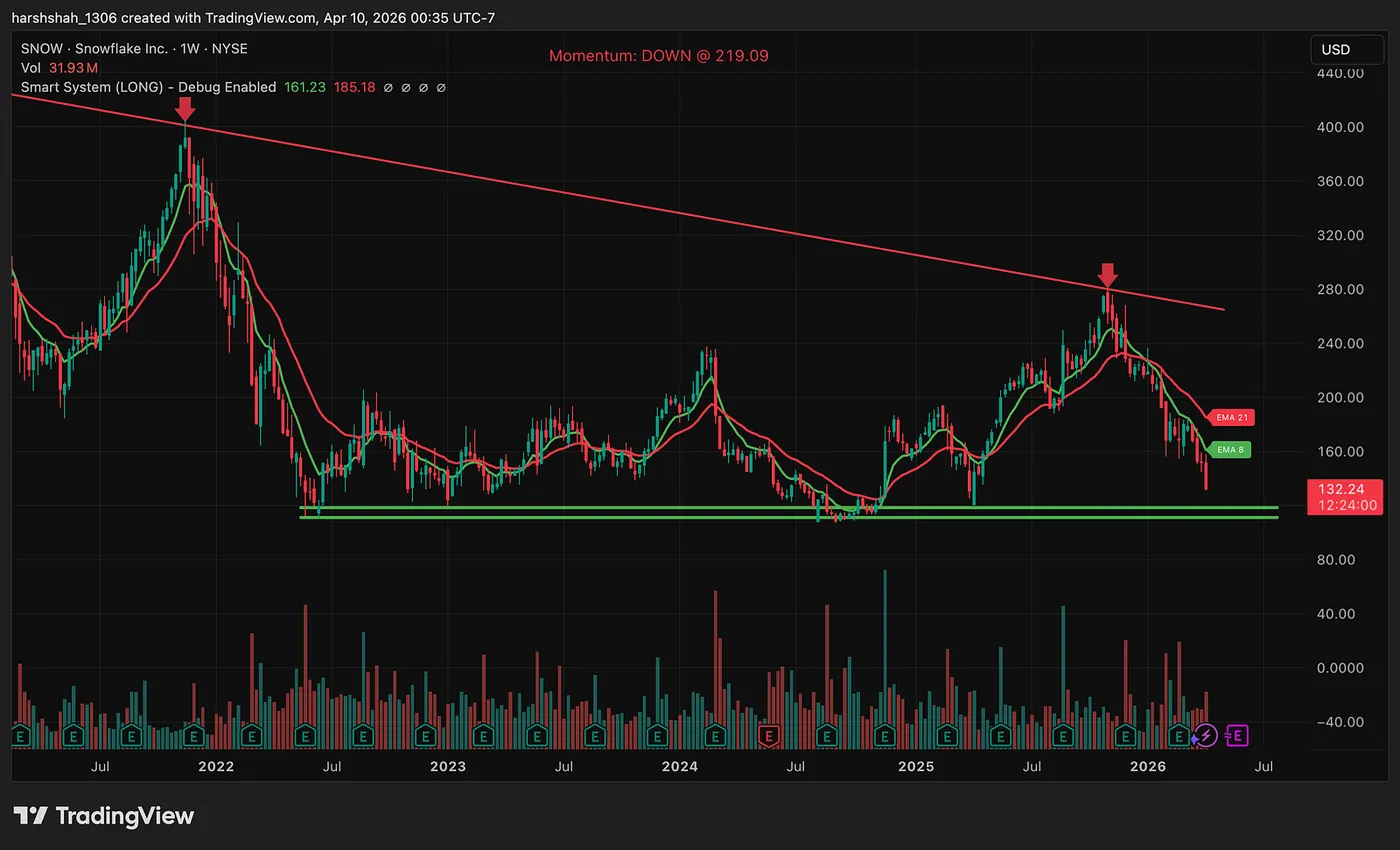
This is where buyers might step in.
But here’s the mistake most people make:
They rush in.
Instead:
- Wait for confirmation
- Look for reversal signals
- Respect the trend
Because right now:
- EMAs are still bearish
- Momentum hasn’t shifted yet
Final Thoughts
This isn’t about Snowflake.
This is about process over prediction.
You don’t need to predict tops.
You don’t need to predict bottoms.
You just need to:
- Respect levels
- Follow momentum
- Stay patient
Most traders lose not because they’re wrong — but because they act too early.