Understanding Technical Analysis
Technical Analysis: The Million-Dollar Skill Every Investor Needs
By Harsh Shah · Updated
Disclaimer:This information is for educational purposes only and should not be considered financial advice.
Ever sold a stock only to watch the price skyrocket right after? Or bought a stock, convinced it was the perfect time, and then seen it plummet? It’s a common experience for investors and traders. We’ve all been there, and it can be incredibly frustrating. While it’s impossible to perfectly time the market, having access to key data points can make a world of difference.
You don’t need a finance degree to understand these data points. In fact, many people, like myself, who come from a different background (I’m a software engineer!), have found that mastering this skill has significantly improved their investment decisions. It’s all about learning to read the market’s language.
Who Can Benefit from This?
You might be wondering if this applies to you. Maybe you’re a passive index investor, a swing trader, or even a day trader. The answer is a resounding yes. My goal is to introduce this perspective to as many people as possible because it has completely changed the way I approach investing. It’s a skill that can add a valuable layer of insight to any strategy, no matter how you choose to play the market.
What is Technical Analysis ?
Technical analysis is a visual and behavioral approach to investing. It’s a way to use data and psychology to make more informed trading decisions. Confused ? Lets go over a couple of real world examples.
Bitcoin — Crypto Investor
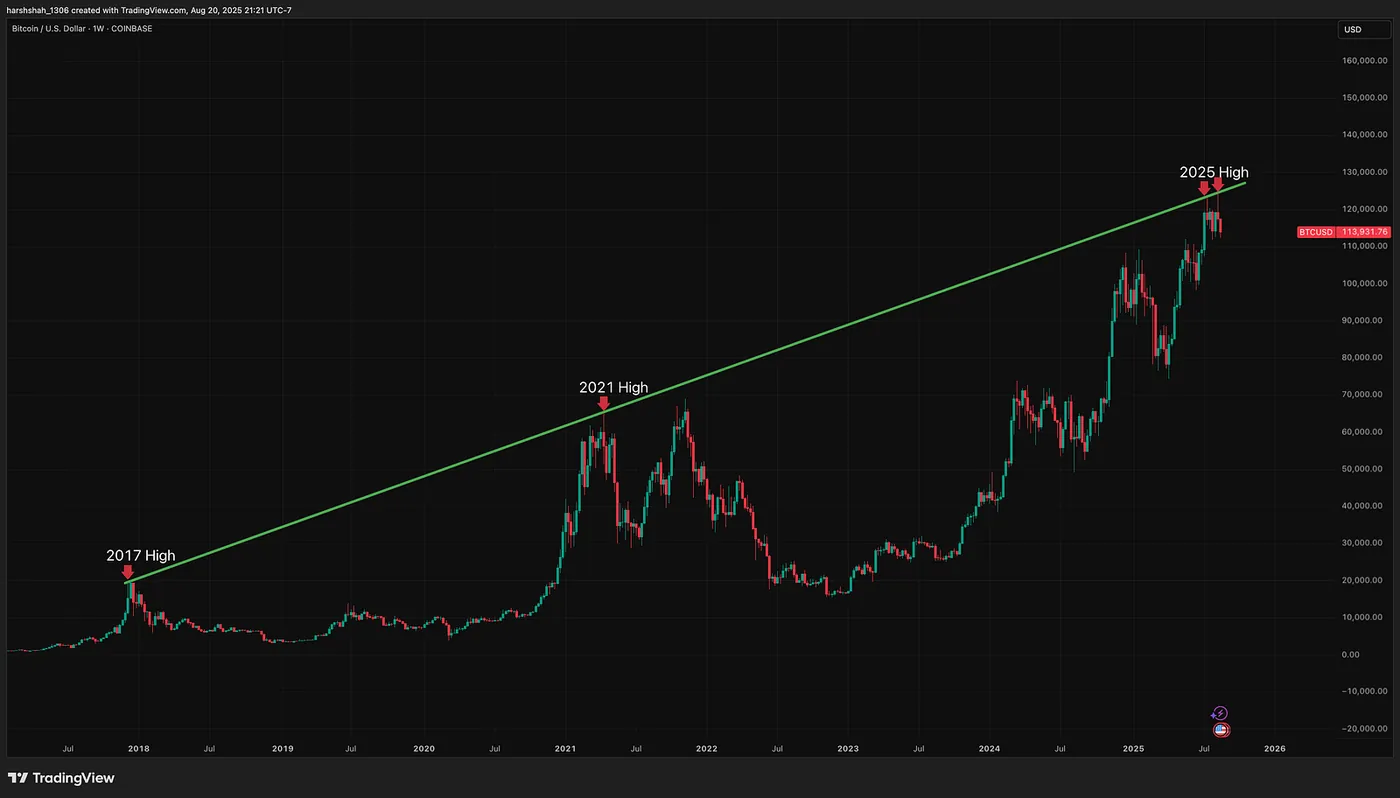
So, you see, technical analysis doesn’t have to be complicated. In its simplest form, it’s about connecting the dots — like drawing a straight line through previous price highs in the above chart.
That chart offered valuable insights that helped me and many others. For example, it could be used to:
a) Book profits by selling Bitcoin at or near the ~$125k resistance level.
b) Stay cautious and avoid investing more at current price levels, anticipating a potential pullback.
c) Take a trading position by shorting the highs for a quick, strategic profit.
It works because millions of people and trading algorithms are all looking at the same signals. When an asset hits one of these key lines, the shared psychology often creates a ceiling.
S&P 500 — For Passive Investor
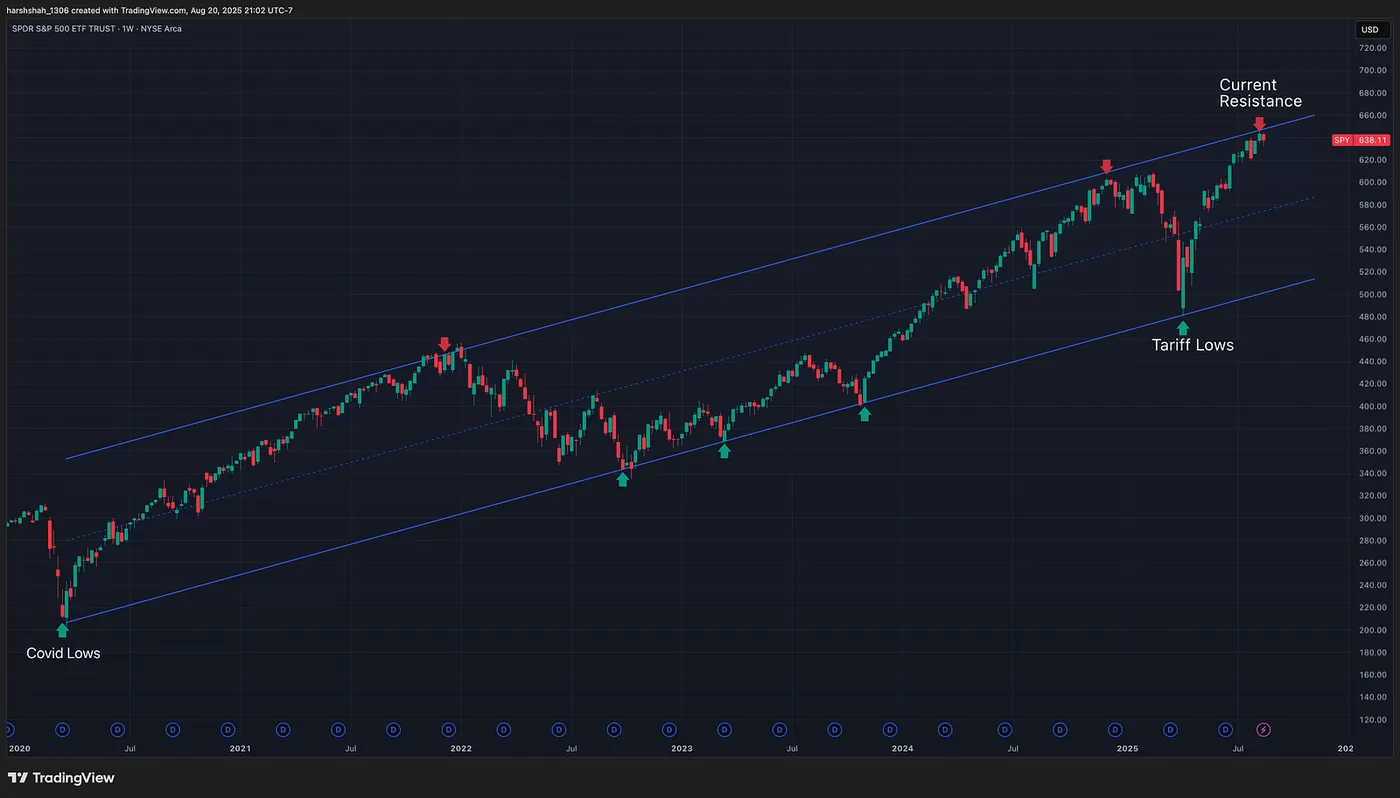
That chart offered valuable insights that helped me and many others. For example, it could be used to:
a) Buy fearlessly during the Tariff crash: By connecting the lows from the COVID-19 crash to subsequent dips, I was able to invest confidently during the recent tariff lows, getting a great entry point near the bottom.
b) Identify current resistance: With the S&P 500 trading near recent highs, the chart indicates this could be a point of significant resistance. This insight helps me hold back on investing or dollar-cost averaging at these levels.
Final Thoughts
My goal is to make technical analysis approachable and fun for everyone. In the following blogs, I’ll explain each concept with real-world chart examples to make the learning process clear and engaging. My hope is to empower more people to confidently enter the world of technical analysis and, in doing so, enhance their investing journey.