Understanding Fibonacci Retracement
Why Meta is holding support at $601 and UNH Defended $320: A Fibonacci Retracement Breakdown
By Harsh Shah · Updated
Disclaimer: This information is for educational purposes only and should not be considered financial advice.
One day, a friend said to me — “Hey, you should start using Fibonacci retracements.”
And I was like, what the heck is that?
Curious, I decided to dig deep — not just into how it works, but why it works. Because once you truly understand the logic behind something, it becomes much easier to use, trust, and connect with.
So, let me share a bit of what I discovered about Fibonacci — and then take it a step further to explain why it actually makes sense in trading too.
What is Fibonacci ?
“Fibonacci” traces back to an Italian mathematician, Leonardo Fibonacci, who introduced a simple yet fascinating number sequence: 0, 1, 1, 2, 3, 5, 8, 13, 21…
It begins with 0, 1, and every number after that is formed by adding the previous two.
The Golden Ratio
Each number is the sum of the two before it, and their ratios (like 21/13 ≈ 1.618, 13/8 ≈ 1.625) converge to the Golden Ratio (1.618).
Before using this in trading, lets take a look at some real world examples where fibonacci sequence shows up!
Fibonacci in Nature: From the Human Body to Pineapples
Fibonacci ratios appear all around us — even in places we don’t consciously notice.
Fibonacci ratios show up throughout nature — even in the human body. Your forearm is about 1.618 times the length of your hand, and the same ratio appears between your shoulder, head, and chin. Even facial proportions that look “naturally beautiful” often follow this pattern.
You’ll also see Fibonacci in plants and natural structures. On a pineapple, for example, the diagonal spirals usually appear as 8 and 13, both Fibonacci numbers. Nature uses these patterns to organize growth efficiently and create balance.
From sunflowers and seashells to storms and galaxies, Fibonacci shapes the world around us.
Markets — Human Behavior in Action
Markets reflect human behavior at scale, and people naturally act in rhythms of growth and pause — much like the Fibonacci patterns we see in nature.
When prices surge or drop, some traders take profits while others step in, causing the price to pull back or retrace.
These corrections often happen around predictable Fibonacci levels, making the same natural patterns we see in pineapples, sunflowers, and shells appear in market movements.
Fibonacci levels
Ever heard about the magical numbers — 61.8, 38.2, 23.6 ? Lets understand how the are derived.
The Golden Ratio (φ ≈ 1.618) comes from the Fibonacci sequence (0, 1, 1, 2, 3, 5, 8, 13…). When you divide one number by the next, you get roughly 0.618 (61.8%), the core Fibonacci ratio.
- 61.8%: comes directly from 1 ÷ φ or (5/8, 8/13) ≈ 0.618
- 38.2%: comes from 0.618² ≈ 0.382 (a smaller correction)
- 23.6%: comes from 0.616³ ≈ 0.236 (a very minor pullback)
- 50%: isn’t from Fibonacci itself, but is used because markets often retrace about halfway.
Understanding Fibonacci Retracement
After a strong price move — up or down — the price often pulls back or “reverses” to certain key levels. This pullback is called a retracement, and when these levels are based on Fibonacci ratios, it’s known as a Fibonacci retracement.
Why Should You Believe in Fibonacci Data?
A fair question — and the answer isn’t “because it’s magic.”
It’s because data and collective behavior back it up.
- Historical Consistency:
When you study charts across decades — from tech stocks to commodities — you’ll find price retracement often land within those Fib zones. It’s not perfect, but it’s statistically common. - Trader Psychology:
Since so many traders, institutions, and even trading algorithms use Fib levels, price tends to react there naturally. It becomes a self-fulfilling prophecy — not because the math controls price, but because people do. - Risk and Reward Planning:
Even if it doesn’t “predict” exactly, it helps traders define logical zones for entries, stops, and targets — giving structure to what would otherwise be emotional decisions. - Market Balance Reflection:
Around the 50–61.8% retracement, buying and selling pressures often find temporary balance — just like natural systems tend to stabilize in proportionate ways. It reflects equilibrium, not superstition.
So, believing in Fibonacci isn’t about trusting in “magic numbers” — it’s about trusting in crowd behavior and probability.
You’re not worshiping a formula; you’re using a tool that measures what humans consistently do in waves of optimism and fear.
How It Works in Trading
Think of Fib levels as potential “rest stops” for price after a strong move.
Here’s how traders typically use it:
a) Identify a big move (from a swing low to a swing high in an uptrend, or high to low in a downtrend).
b) Draw the Fibonacci retracement tool from the start to the end of that move.
c) The tool automatically plots levels like 23.6%, 38.2%, 50%, 61.8%, and 78.6%.
Each of these levels acts like a checkpoint where price might:
Pause (consolidate)
Reverse (bounce or reject)
Or continue (if it breaks through)
How to Use It Wisely
Here are some practical tips:
- Combine with other signals: Fib levels are most reliable when they line up with other indicators — like trendlines, moving averages, or volume spikes.
- Don’t treat them as exact points: Think in zones — price might react anywhere near the 61.8% level.
- Use the right timeframe: For swing trades, use daily or 4-hour charts. For intraday, use shorter timeframes like 15-min or 1-hour.
Common Mistakes to Avoid
- Forcing it everywhere.
Not every move needs a Fib. Use it after a clear, strong trend leg. - Ignoring the bigger picture.
Fib works best when aligned with the overall trend direction. - Expecting perfection.
It’s not a prediction tool — it’s a planning tool.
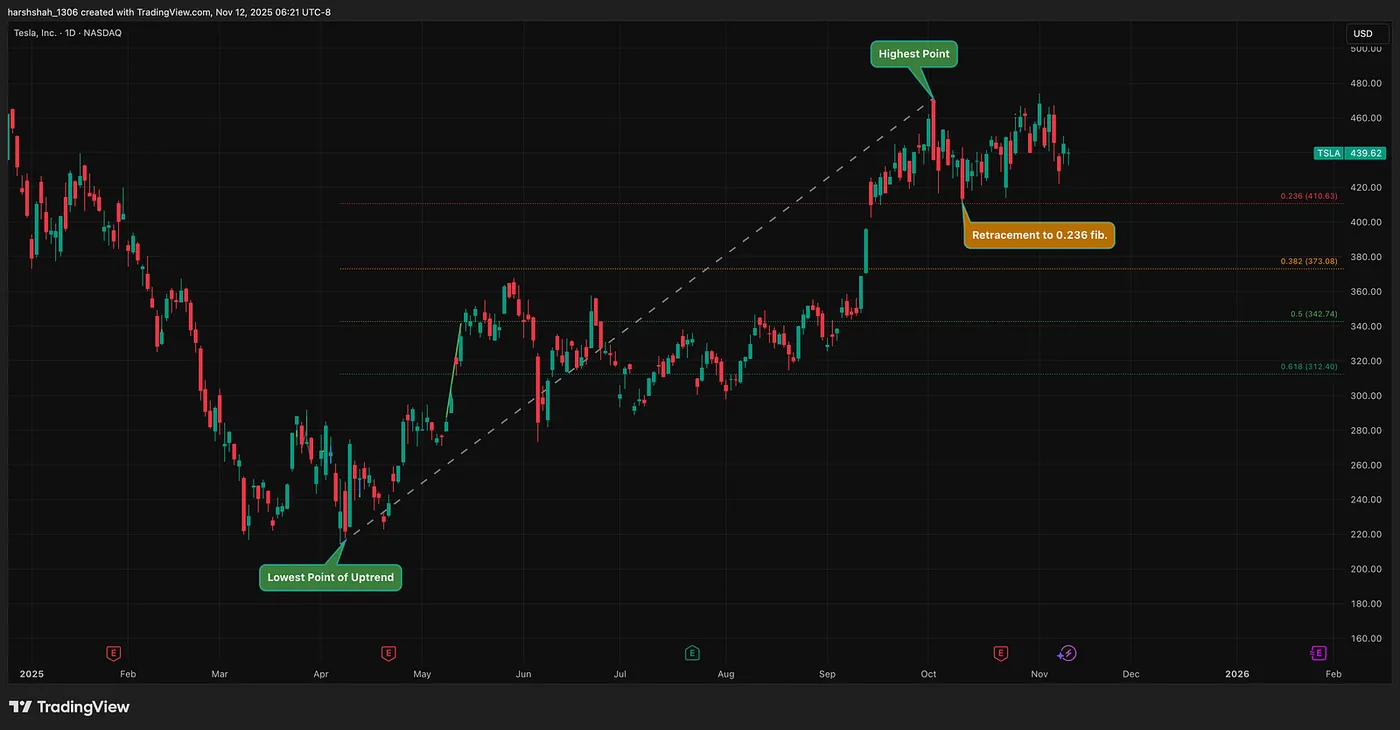
TSLA — A classic retrace to the 23.6% level
Draw the Fibonacci retracement from the lowest point to the highest point of the uptrend. Tesla then pulled back exactly to the first Fibonacci level, matching the price in dollars.
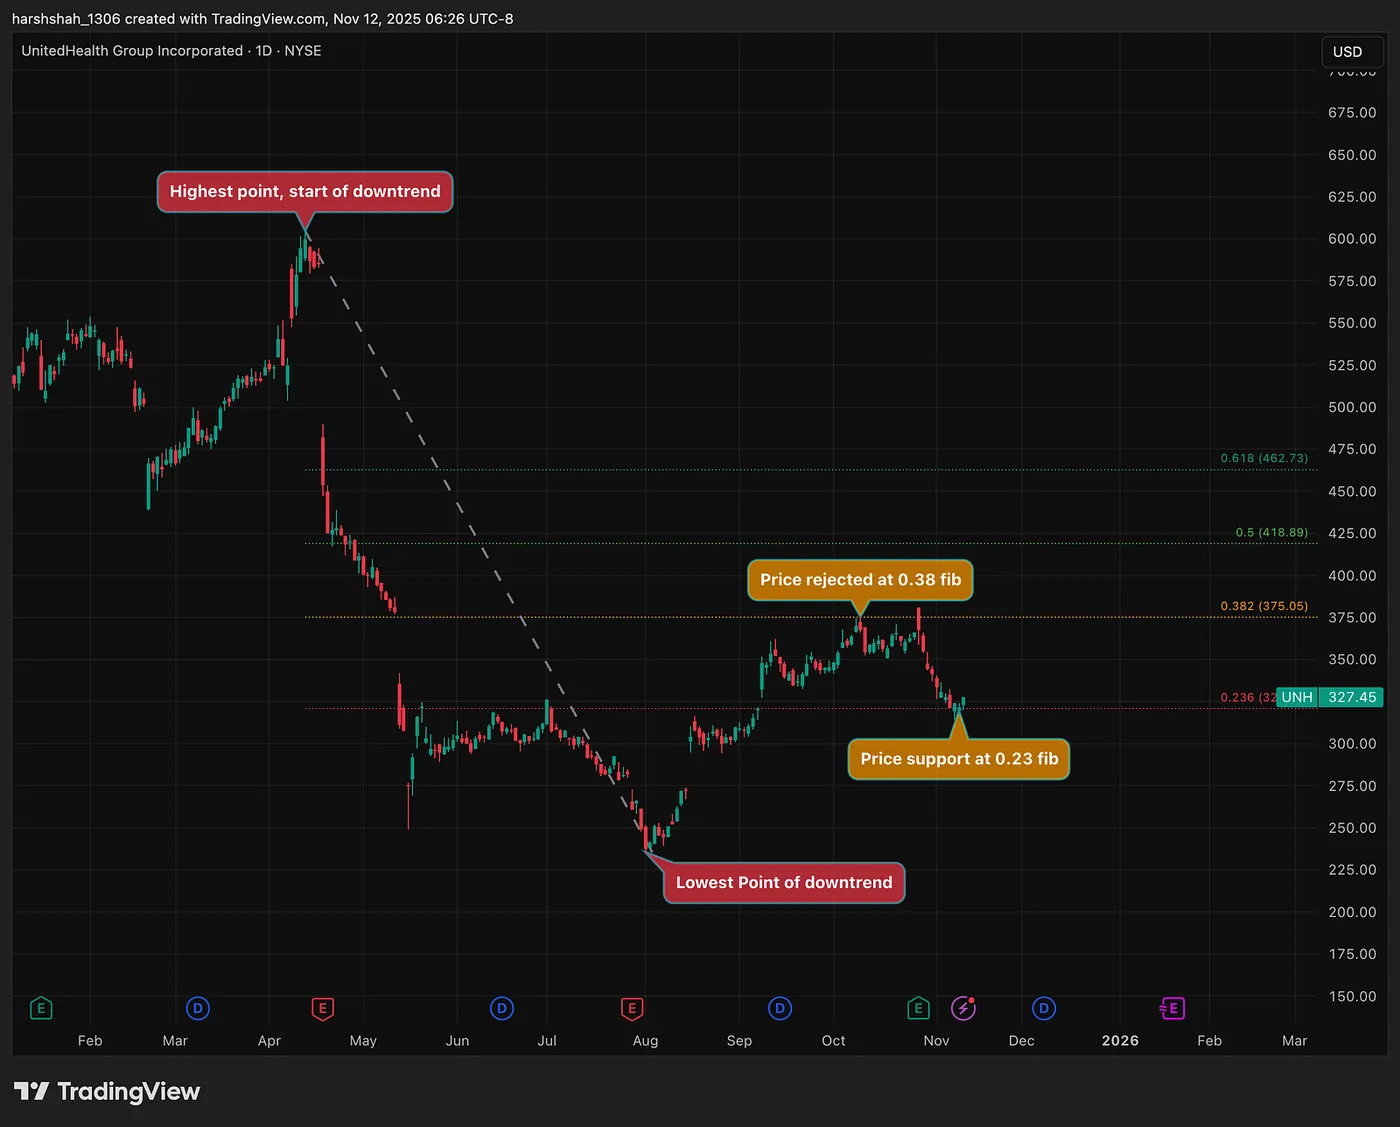
UNH — Why price got rejected at 380$ and bouncing back from 315
UNH was rejected around $380, lining up with the 38% Fibonacci retracement and a gap-fill resistance. After that, the stock pulled back to the 23% Fibonacci support zone, where it’s currently holding.
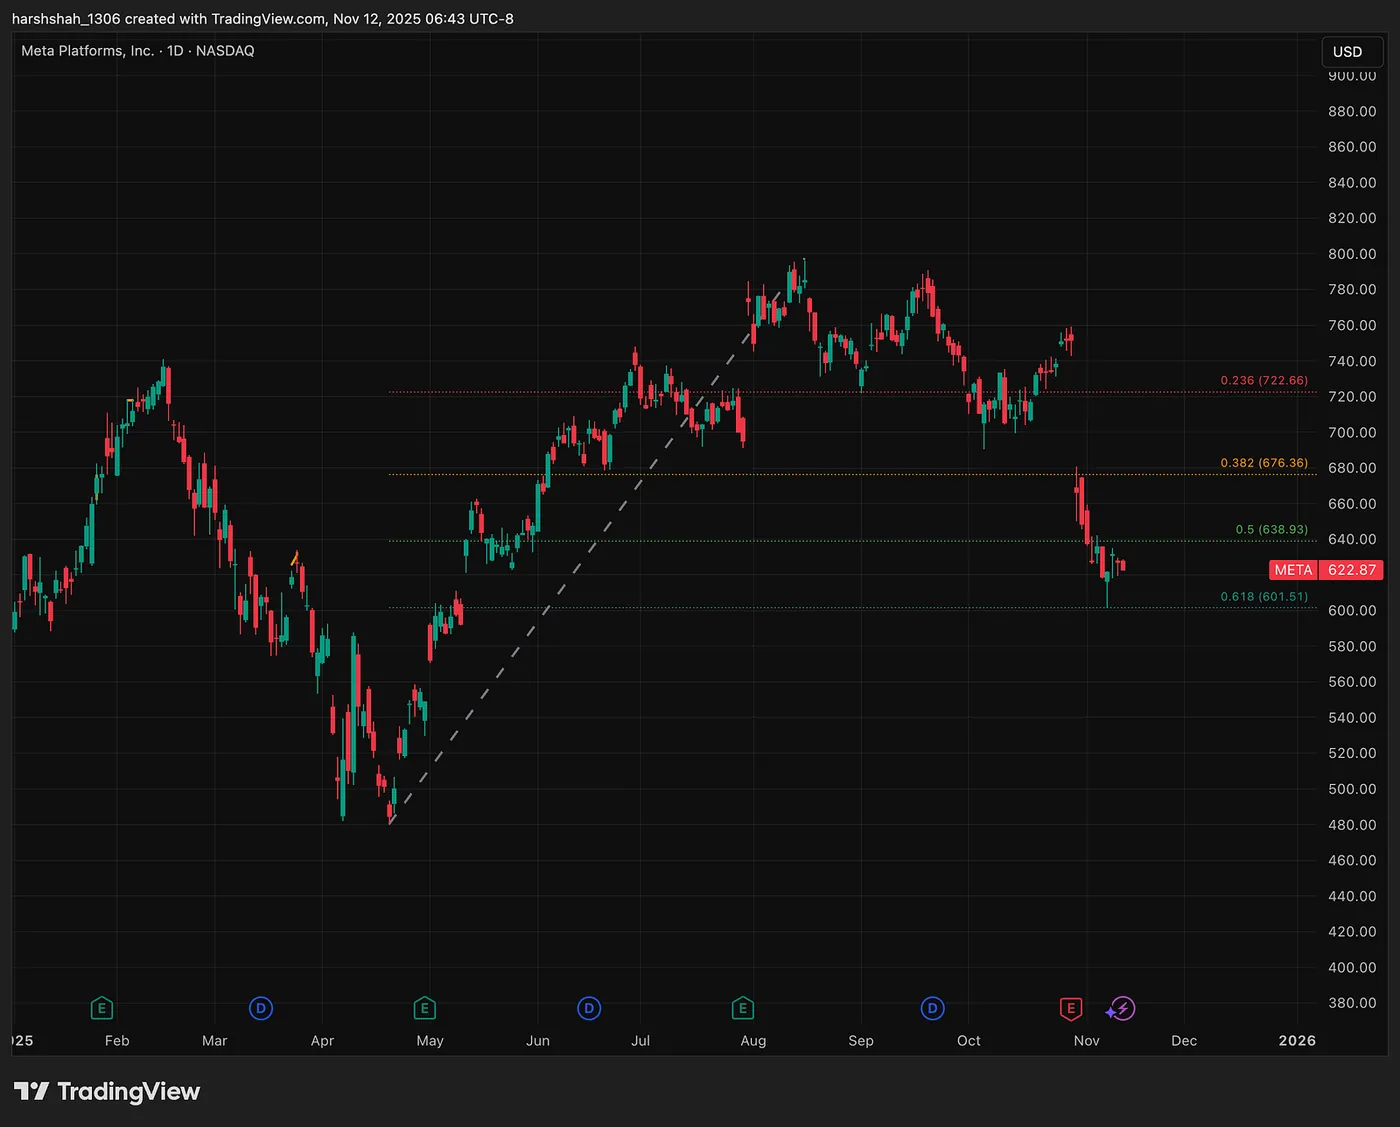
META — Why did Meta pull back and stall around the $601 level?
If you draw a Fibonacci retracement from the lowest point of the uptrend to the highest point, you’ll see that $601 lines up perfectly with the 0.618 retracement level.
Final Thoughts
“Trading isn’t about predicting — it’s about preparing. Fibonacci helps you prepare.”
Fibonacci retracement is like a map of potential turning points.
It helps you plan trades, spot areas of interest, and manage risk — especially during pullbacks.
The next time you see a stock running up fast, try plotting a Fib retracement on the pullback.
You’ll be surprised how often price “respects” those levels — like invisible handrails guiding the move.