Understanding Gap Fills
Why UNH reversed from ~380$ level , Meta heading to 590$ — Gap Fills in Action.
By Harsh Shah · Updated
Disclaimer: This information is for educational purposes only and should not be considered financial advice.
What are Gaps?
Imagine your stock chart like a staircase — each day’s price is one step.
Normally, each new step is right next to the previous one.
But sometimes, you wake up in the morning and the next “step” jumps way higher or way lower — leaving an empty space between them.
That empty space on the chart?
That’s what traders call a gap.
Why do gaps happen?
Gaps usually happen overnight — when something big hits the news:
- The company reports strong earnings (price jumps up at the open).
- Or bad news drops (price gaps down).
- Or the overall market has a huge move when the stock market was closed.
So when the market opens the next morning, the price skips a few levels up or down.
It doesn’t trade through those levels — it jumps straight past them.
What does “filling the gap” mean?
Here’s where it gets interesting.
A “gap fill” means — the stock later moves back into that empty space and trades through it.
In simple words:
👉 The stock goes back to the area it skipped earlier.
If it gapped up, it might come down later to “fill” that missing area.
If it gapped down, it might rise later and “fill” that space.
Gap Fills are powerful support levels— when price falls into gap fills.
Gap Fills are powerful resistance levels — when price rises into gap fills.
The bigger the gap, the more powerful the support/resistance when price trades back to the gap fill.
Why do gaps tend to fill — the psychology ?
Now, this is where psychology comes in — not just charts.
Think of it like this:
- When a stock gaps up, everyone who missed buying feels left out.
When the price starts to drop back, they jump in — causing support around that level. - When a stock gaps down, people who missed selling earlier might sell when price bounces back, creating resistance there.
In both cases, the price tends to revisit that “gap area” — almost like unfinished business.
Key Rules to identify gap fills
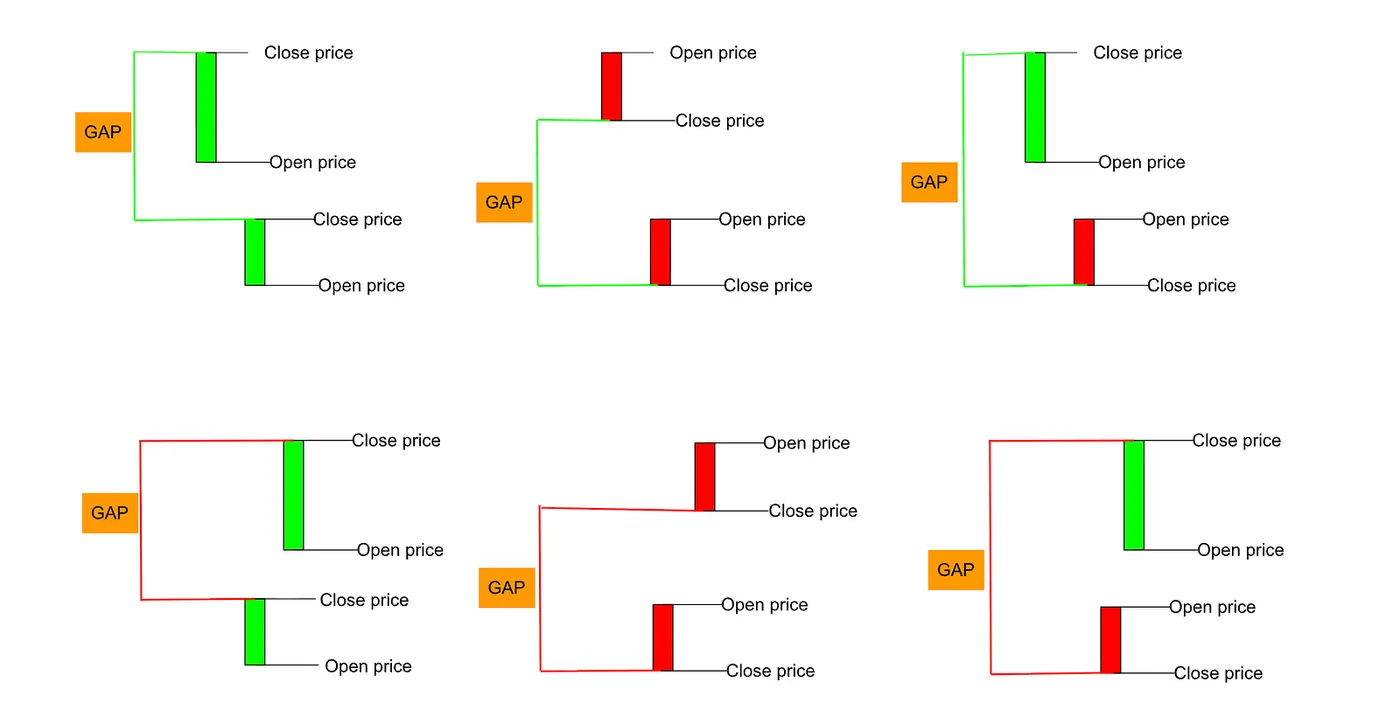
A gap is considered “filled” or “closed” when the price moves back to the pre-gap level (the previous day’s close)
Lets illustrate this with a few examples!
Does every gap get filled?
Nope.
Not all gaps are equal — and not all get filled quickly.
There are a few common types:
- Common Gap — Just regular day-to-day noise. These usually fill soon.
- Breakaway Gap — Happens when a big move starts. These might never fill quickly.
- Runaway (Continuation) Gap — Happens in the middle of a strong trend. These can stay open for months.
- Exhaustion Gap — Happens near the end of a move. These often fill fast.
So — the “gap fill” idea isn’t a magic rule.
It’s a tendency, not a guarantee.
UNH — Gap Fill acted as resistance
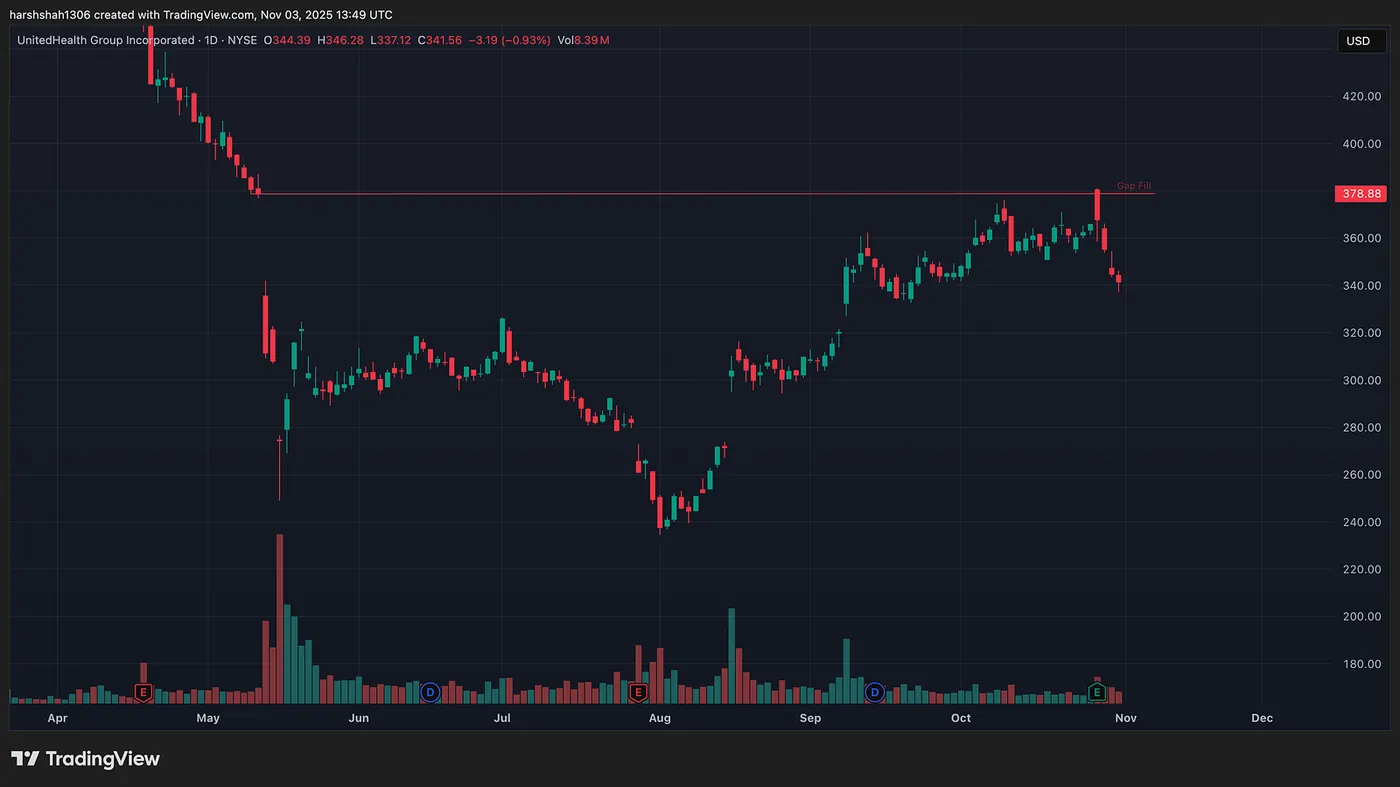
UNH recently struggled to break above its gap fill area ~380$, which acted as a strong resistance level — and that gap is now filled.
GEV
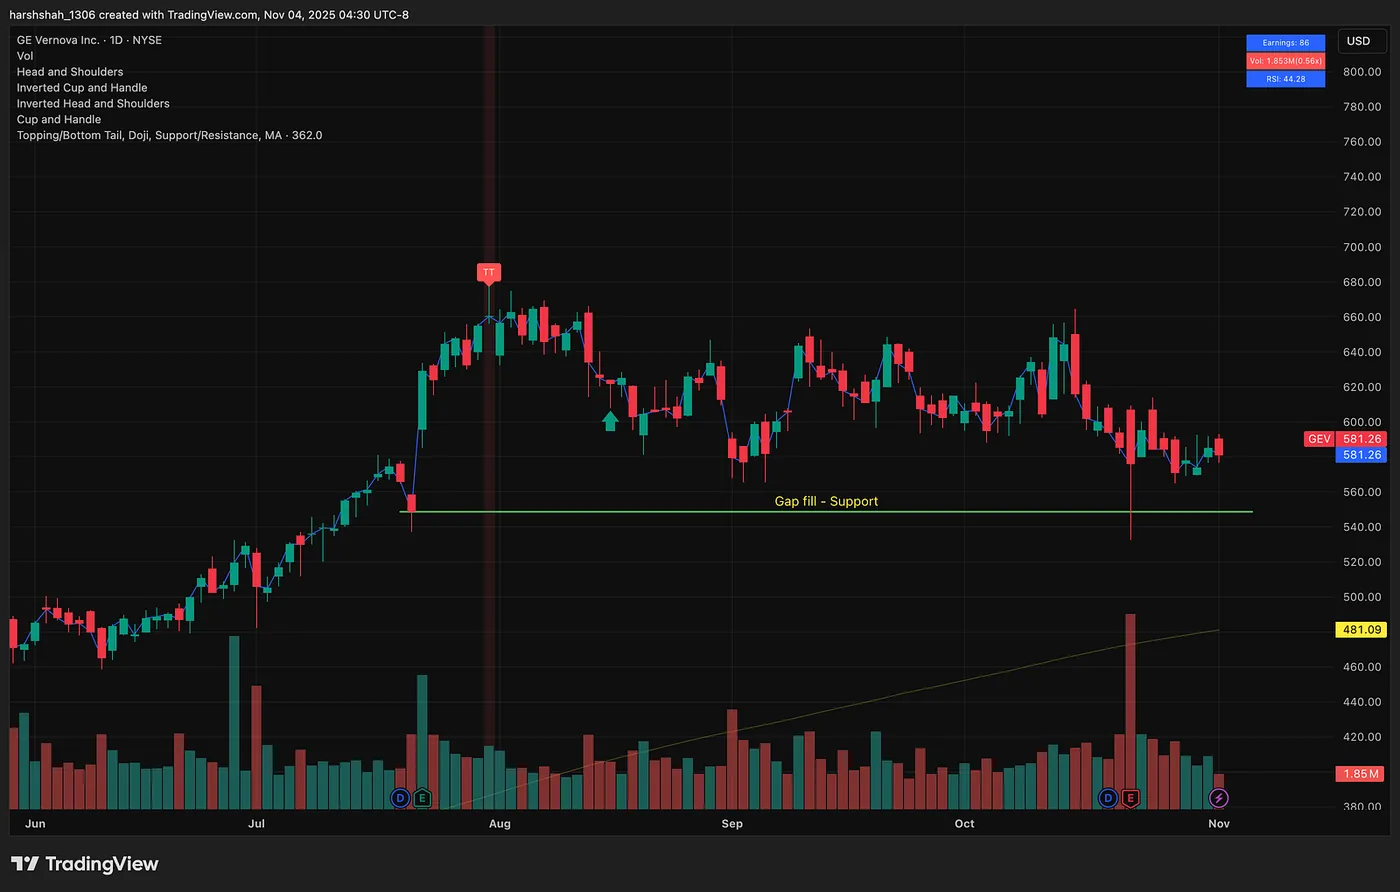
The gap fill around $550 acted as a strong support level.
META — Heading to Gap Fill
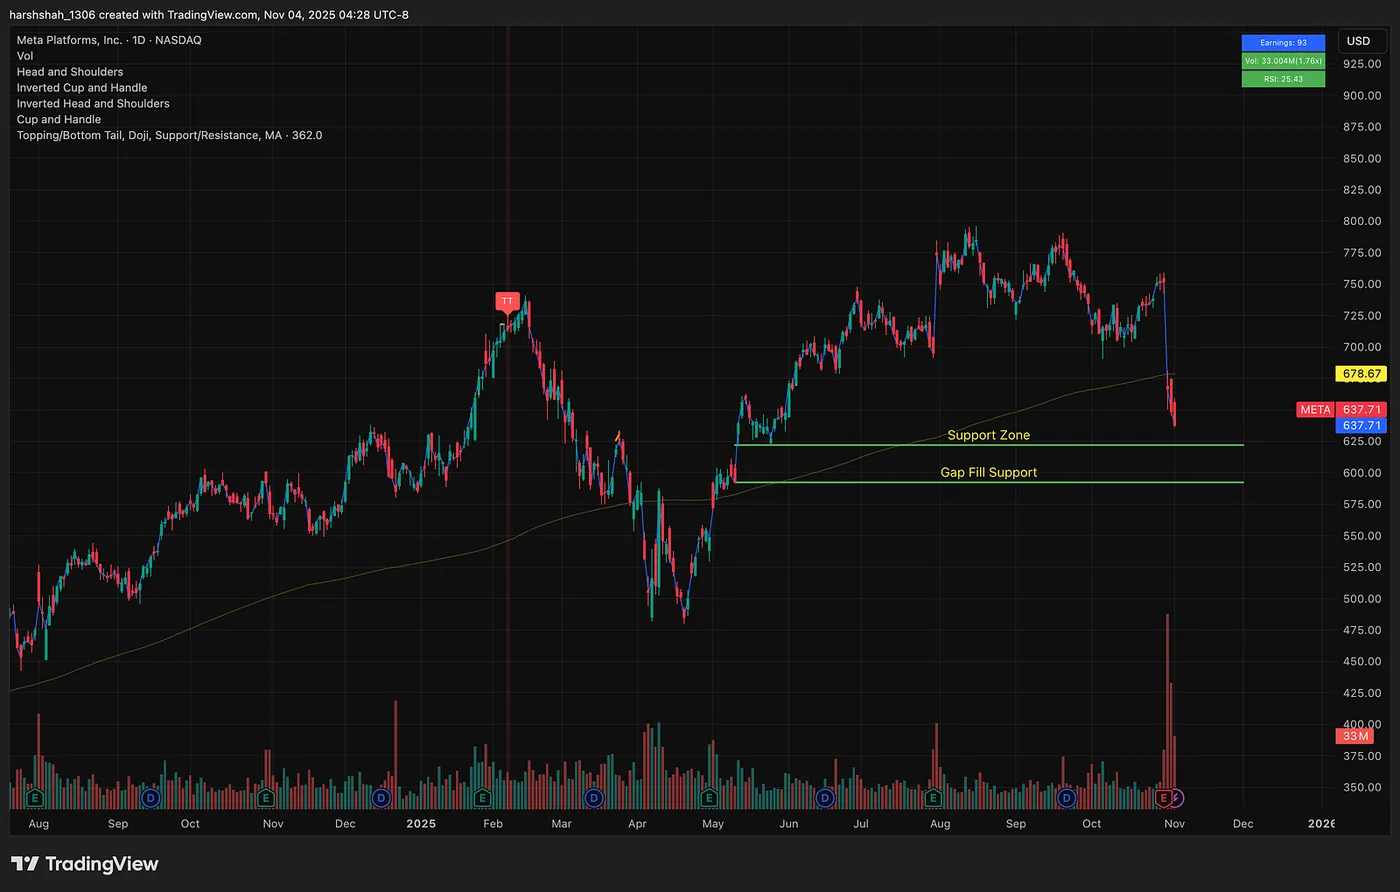
Following a post-earnings sell-off, META is approaching a gap fill support zone near $600. If this level fails to hold, the next gap fill lies around $530.
Final Thoughts
A gap is just a price area where no one traded.
And markets have a funny way of coming back to revisit unfinished business.
So, next time you see a stock that jumped overnight, mark that gap area.
You’ll be surprised how often price circles back there later — just like a boomerang.