Oracle Dropped 49% in 3 Months, I Purchased $10,000 Worth at $179.63 Here’s Why….
By Harsh Shah · Updated
Disclaimer: This information is for educational purposes only and should not be considered financial advice.
Oracle marked a high near $345 on September 10th.
Was I a buyer at that level? Absolutely not.
Technical analysis helped me stay grounded and avoid chasing momentum. Instead, I waited patiently for price to come back to logical, high-probability levels.
In this post, I’ll walk you through:
- Why I avoided Oracle near the highs
- How gap fills helped define my entry zones
- Why I finally entered at $179.63, after a 49% correction in just three months, backed by a two-factor technical setup
(I’ve also attached a screenshot of the transaction and verified P&L.)

Before breaking down the exact setup, let’s first understand the power of gap fills.
What are Gaps?
Imagine your stock chart like a staircase — each day’s price is one step.
Normally, each new step is right next to the previous one.
But sometimes, you wake up in the morning and the next “step” jumps way higher or way lower — leaving an empty space between them.
That empty space on the chart?
That’s what traders call a gap.
Why do gaps happen?
Gaps usually happen overnight — when something big hits the news:
- The company reports strong earnings (price jumps up at the open).
- Or bad news drops (price gaps down).
- Or the overall market has a huge move when the stock market was closed.
So when the market opens the next morning, the price skips a few levels up or down.
It doesn’t trade through those levels — it jumps straight past them.
What does “filling the gap” mean?
Here’s where it gets interesting.
A “gap fill” means — the stock later moves back into that empty space and trades through it.
In simple words:
👉 The stock goes back to the area it skipped earlier.
If it gapped up, it might come down later to “fill” that missing area.
If it gapped down, it might rise later and “fill” that space.
Gap Fills are powerful support levels — when price falls into gap fills.
Gap Fills are powerful resistance levels — when price rises into gap fills.
The bigger the gap, the more powerful the support/resistance when price trades back to the gap fill.
Why do gaps tend to fill — the psychology ?
Now, this is where psychology comes in — not just charts.
Think of it like this:
- When a stock gaps up, everyone who missed buying feels left out.
When the price starts to drop back, they jump in — causing support around that level. - When a stock gaps down, people who missed selling earlier might sell when price bounces back, creating resistance there.
In both cases, the price tends to revisit that “gap area” — almost like unfinished business.
Key Rules to identify gap fills
A gap is considered “filled” or “closed” when the price moves back to the pre-gap level (the previous day’s close)
Lets illustrate this with a few examples!
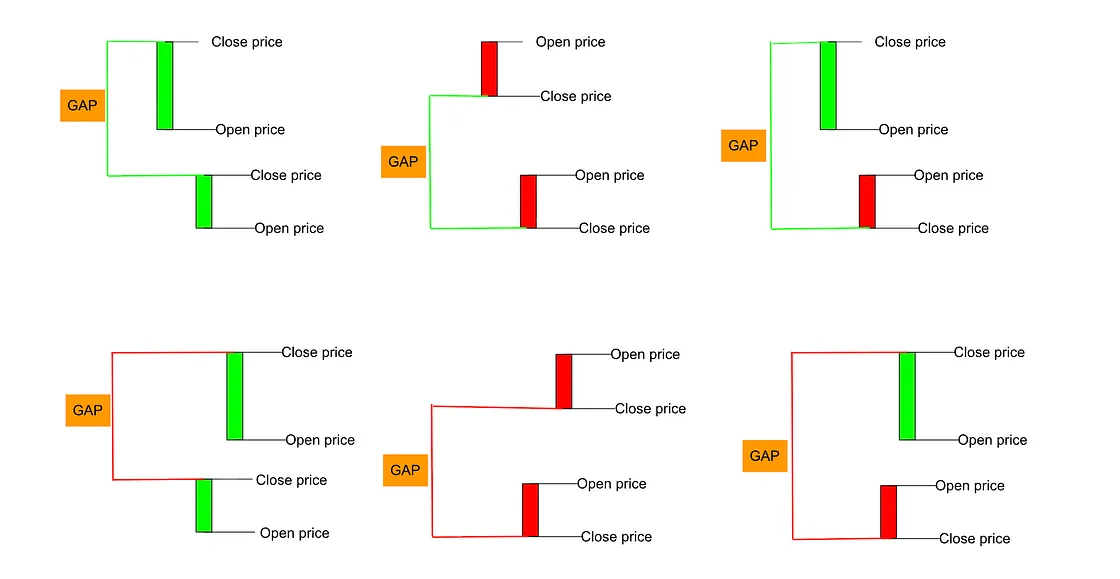
Does every gap get filled?
Nope.
Not all gaps are equal — and not all get filled quickly.
There are a few common types:
- Common Gap — Just regular day-to-day noise. These usually fill soon.
- Breakaway Gap — Happens when a big move starts. These might never fill quickly.
- Runaway (Continuation) Gap — Happens in the middle of a strong trend. These can stay open for months.
- Exhaustion Gap — Happens near the end of a move. These often fill fast.
So — the “gap fill” idea isn’t a magic rule.
It’s a tendency, not a guarantee.
Now, lets breakdown the setup.
September 10 — A Day to Remember
Oracle surged ~40% on earnings.
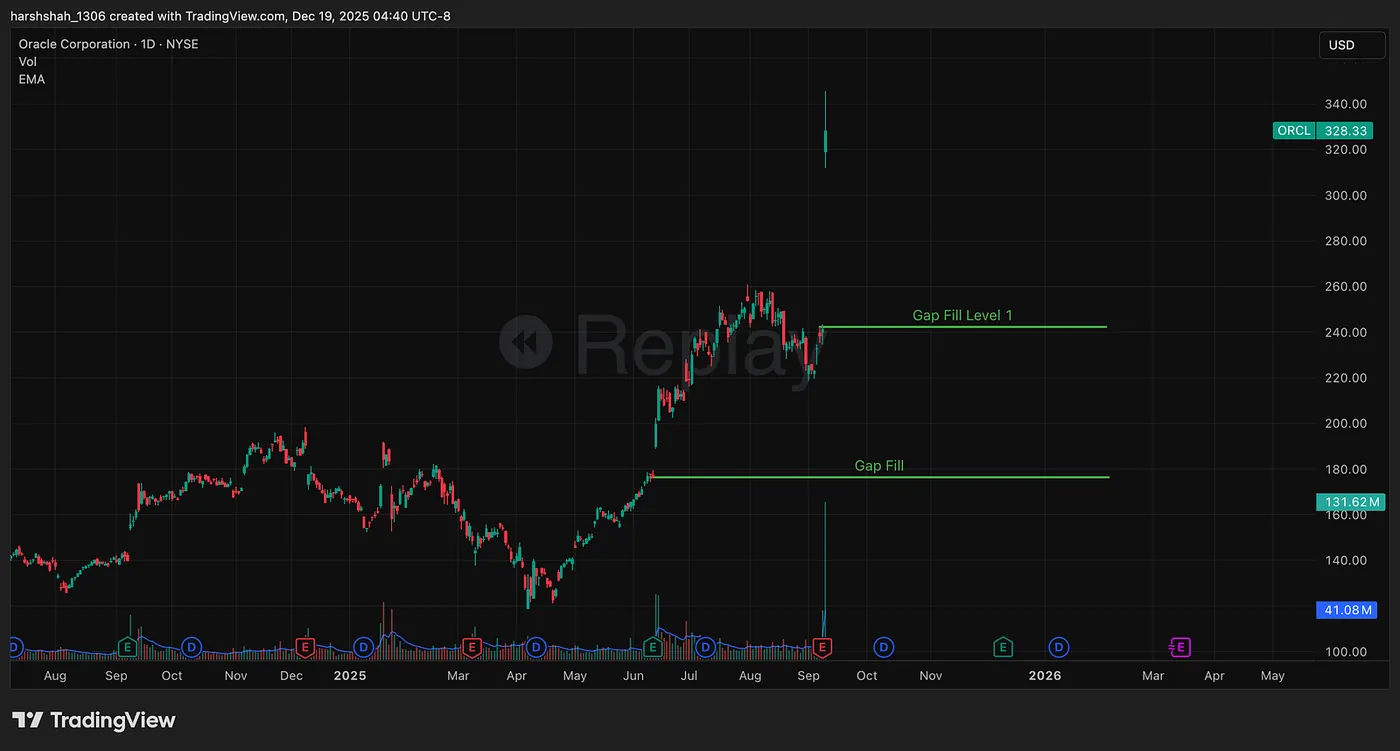
Did I buy? No.
There were no clean trendlines or nearby supports. Instead, I mapped out gap levels created by the move.
Key gap fill zones:
- Gap Fill 1: ~$242
- Gap Fill 2: ~$176
I waited.
November 6, 2025
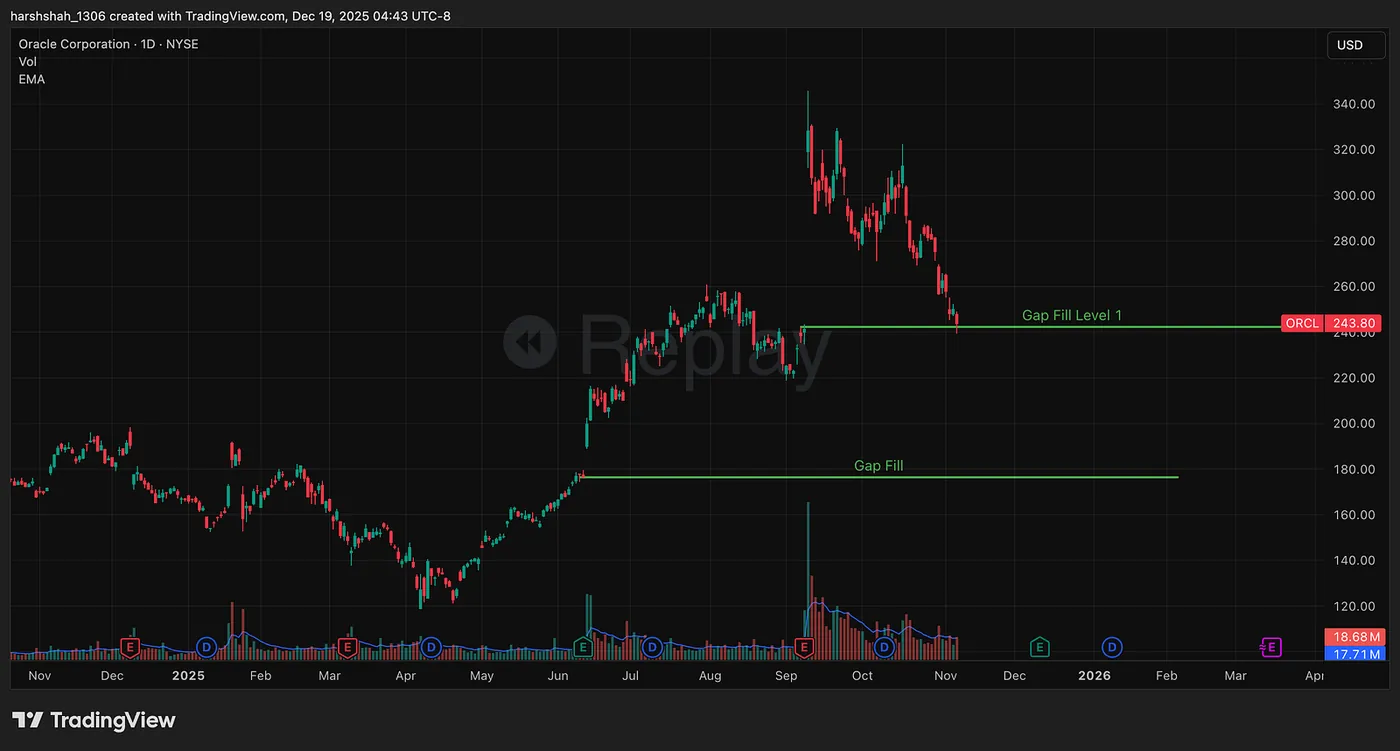
Oracle reached the first gap fill.
Still, I didn’t act.
I was looking for a second factor — something to improve probability. Price action remained weak, suggesting further downside.
Just X days later, Orcale hit the first gap fill. But I was looking for a 2nd factor, to tilt the odds on my favor. I closely monitored the price action, and eventually it was headed down.
December 18, 2025
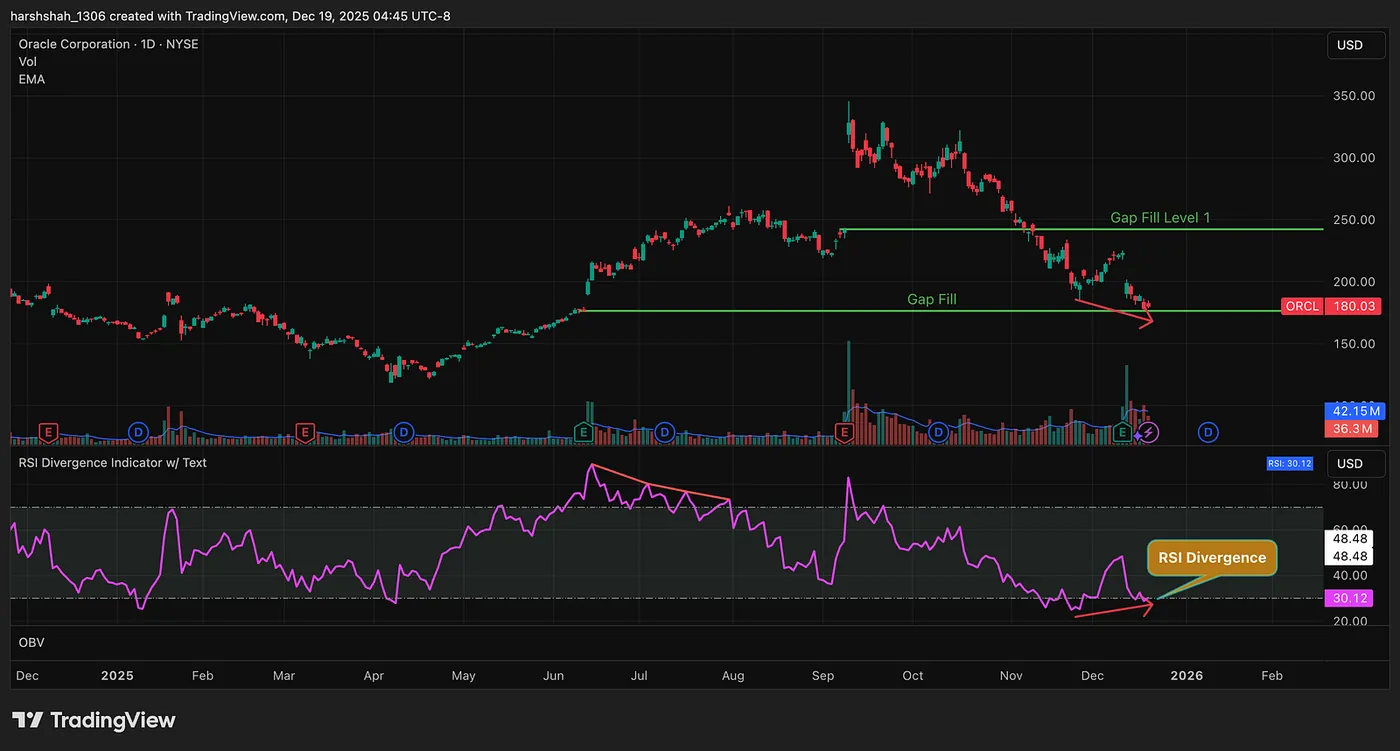
Oracle finally tagged the second gap fill near $176, and this time:
- A clear RSI bullish divergence appeared
- Price had already corrected ~49% in three months
This created a high-quality, two-factor long setup with defined risk and favorable reward.
That’s where I entered.
Am I Holding This Long-Term?
Not necessarily.
This is a pure technical trade.
Over the coming days:
- I’ll identify resistance zones
- Look to exit as price becomes overextended
- Or reassess if the structure evolves into a long-term hold
Flexibility matters — the chart decides.
Final Thoughts
This trade wasn’t about predicting bottoms or catching headlines.
It was about patience, structure, and probability.
Technical analysis didn’t tell me what to buy — it told me when not to buy, and later, when risk was defined.
Big moves create big emotions.
Gaps, corrections, and divergences help cut through that noise.
Markets reward discipline — not excitement.