Understanding Support & Resistance
Trading with a Plan: How I Use Support & Resistance to Beat Emotional Trading
By Harsh Shah · Updated
Disclaimer: This information is for educational purposes only and should not be considered financial advice.
Understanding Support
A support level is a price where a stock tends to stop falling because many buyers step in.
The Story of Mr. Drew and the $10 Support
Mr. Drew had been watching a stock priced at $10. He wanted to buy, but before he could act, the price surged to $14.
“Too high,” he thought. “I’ll wait. If it ever comes back to $10, I’ll buy.”
Weeks passed, and the stock finally pulled back to $10. Just as he had planned, Mr. Drew made his purchase.
But here’s the interesting part: Mr. Drew wasn’t alone. When a stock’s price approaches a key level like $10, it attracts a diverse group of buyers: disciplined traders waiting for the entry point, regretful buyers eager not to miss out again, and existing holders who feel validated and may add to their position.
This is what traders call a support level — a price zone where buying pressure is strong enough to prevent further decline.
Understanding Resistance
A resistance level is a price point on a chart where an uptrend is expected to pause due to a concentration of supply.
The Story of Ms. Jane and the $14 Resistance
Ms. Jane had been watching a stock she purchased at $14. She wanted to sell, but before she could act, the price dropped to $10.
“Too low,” she thought. “I’ll wait. If it ever comes back to $14, I’ll sell.”
Weeks passed, and the stock finally rallied back to $14. Just as she had planned, Ms. Jane sold her shares.
But here’s the interesting part: Ms. Jane wasn’t alone. When a stock’s price approaches a key level like $14, it attracts a diverse group of sellers: disciplined traders waiting for their exit point, regretful sellers eager not to miss out on their chance to exit, and existing short sellers who feel validated and may short even more.
This is what traders call a resistance level — a price zone where selling pressure is strong enough to prevent a further price increase.
Over the long term, the stock price always follows the business behind it.
📉 Scenario: When Support Breaks
You’ve been watching a stock with strong support at $10. Each time the price touched $10, it bounced back up.
But this time, something’s different:
- Earnings are disappointing.
- Market sentiment is weak.
- The price falls below $10 and closes at $8.
The trusted support is broken.
What Does This Mean?
A broken support often flips into resistance. Here’s the psychology:
Trapped buyers who bought at $10 are now sitting on losses. If the stock climbs back to $10, many of them will sell “just to get out even.”
This selling pressure creates a new resistance level at the old support.
📈 Scenario: When Resistance Breaks
You’ve been watching a stock struggle to climb past $20. Each time the price touched $20, it was pushed back down.
But this time, something’s different:
- Earnings are stronger than expected.
- Market sentiment is bullish.
- The price pushes above $20 and closes at $24.
The stubborn resistance is broken.
What Does This Mean?
A broken resistance often flips into support. Here’s the psychology:
Trapped sellers who sold at $20 before now regret their decision. If the stock dips back toward $20, they’re eager to buy in, pushing demand higher.
New buyers see the breakout as a sign of strength and wait to enter on a pullback to $20.
This collective behavior creates fresh demand, turning the old resistance into a new support level.
Note: A single candlestick breaking a support or resistance level doesn’t necessarily confirm a true breakout. To avoid getting trapped in a “fakeout,” it’s important to wait for confirmation signals. We’ll dive deeper into this in a future post.
Lets dive deeper into a real world example.
Intel (INTC) — Multiple Opportunities Identified
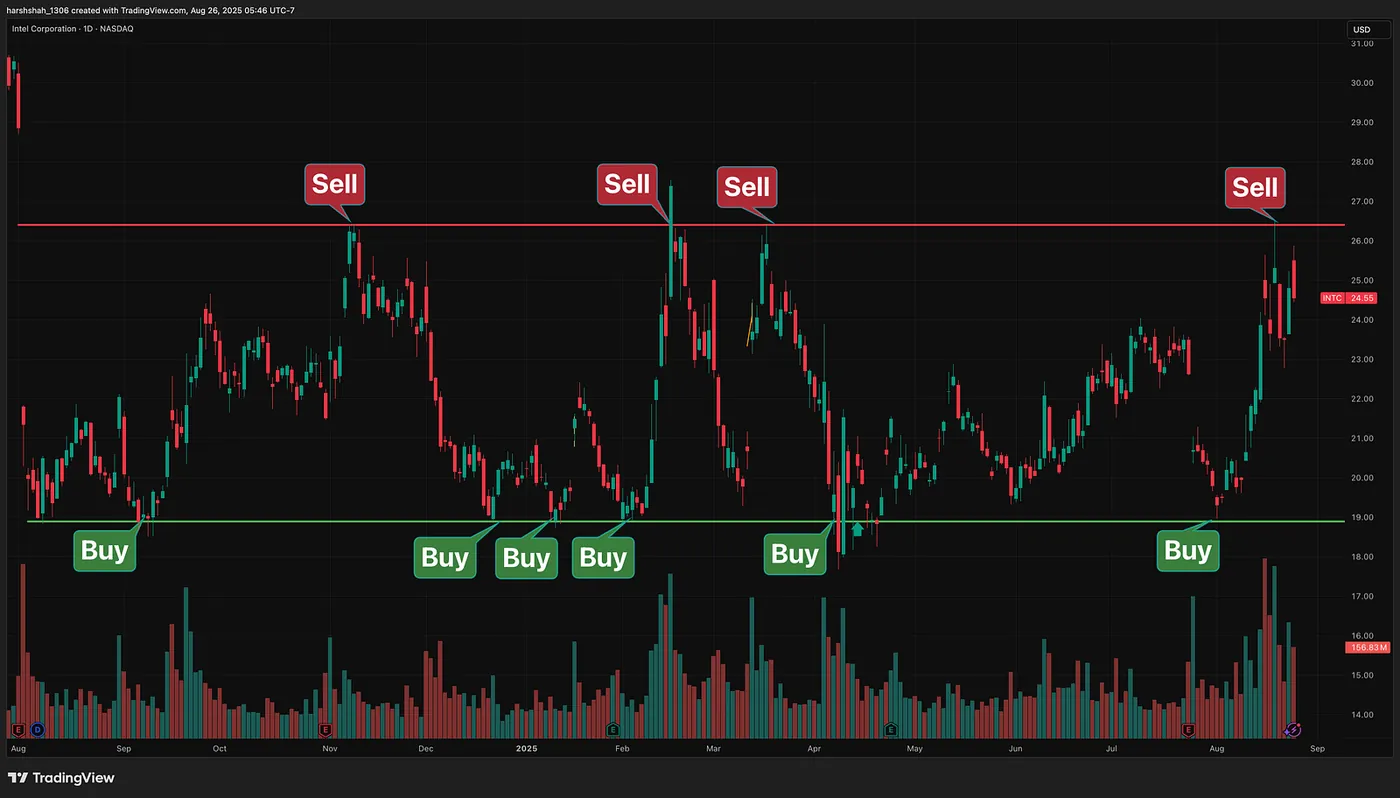
Intel’s stock ($INTC) is currently trading within a clear range, with a strong support level around $19 and a resistance level near $25. This clearly defined range offered traders and investors several prime opportunities to buy at lows and sell at highs.
Notice the volume spikes at these key price points, which highlight the intense struggle between buyers and sellers as they defend or try to break through these levels.
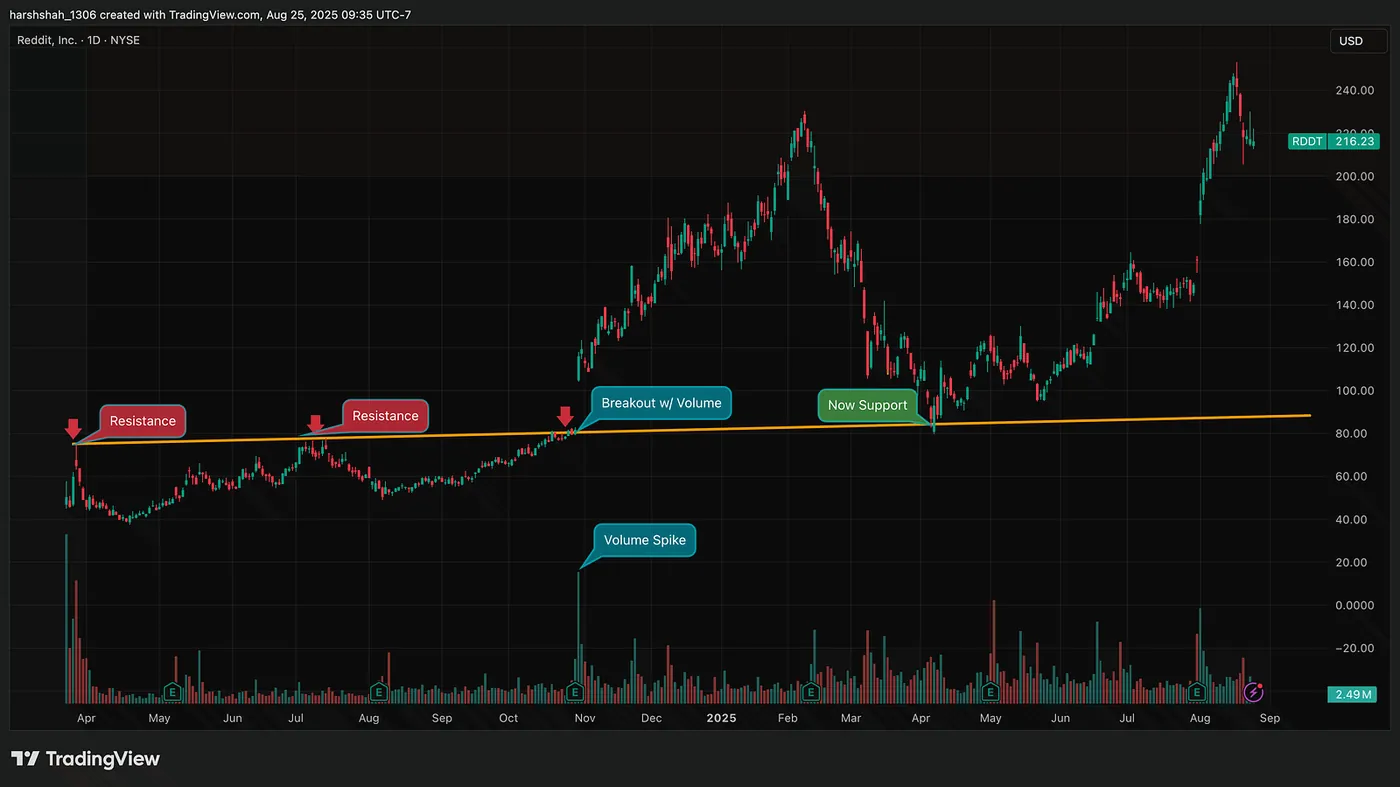
Reddit (RDDT) — When Resistance becomes Support
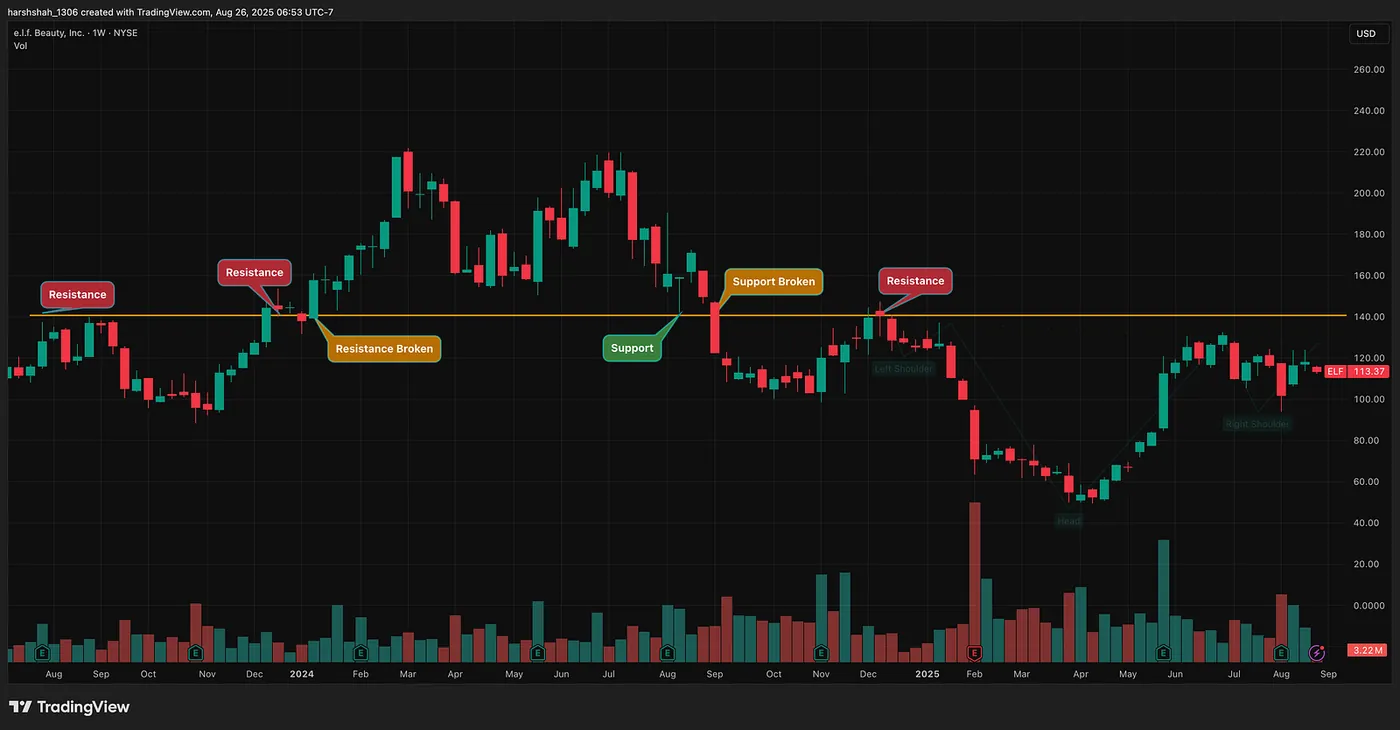
ELF — When Support becomes Resistance
Final Thoughts
Support and resistance work because people buy at lows and sell at highs, and trading algorithms do the same, reinforcing these price levels.