Understanding the Bullish Engulfing Candle
The Bullish Engulfing Candle — A Simple Signal That Buyers Are Back
By Harsh Shah · Updated
Disclaimer: This information is for educational purposes only and should not be considered financial advice.
Have you ever looked at a stock chart and wondered when the “turnaround” might begin?
One of the most powerful — yet simple — clues often comes from a single candle: the Bullish Engulfing Candle.
Let’s break it down.
The fight between Mr. John and Mr. Bob
For weeks, Mr. John and the bears had been feasting on Stock X. They mercilessly dragged the price down from $130 to a weary $90, celebrating their victory every step of the way.
Thinking they had it beat, they went in for the final blow: a crushing 10% drop that sent the stock tumbling from $90 to $81 in a single day. The bears were roaring. It looked like a total collapse.
But they made one critical mistake. They pushed the price right into an ambush.
Mr. Bob and an army of patient bulls were waiting at the $81 level. The next day, as the price briefly dipped to $79, they launched their counter-attack. A single, mammoth green candle erupted on the chart, rocketing the price all the way up to $93.
In one spectacular move, the bulls didn’t just stop the bleeding — they completely reversed the sentiment, trapping the bears and announcing that a new king was in town.
What Is a Bullish Engulfing Candle?
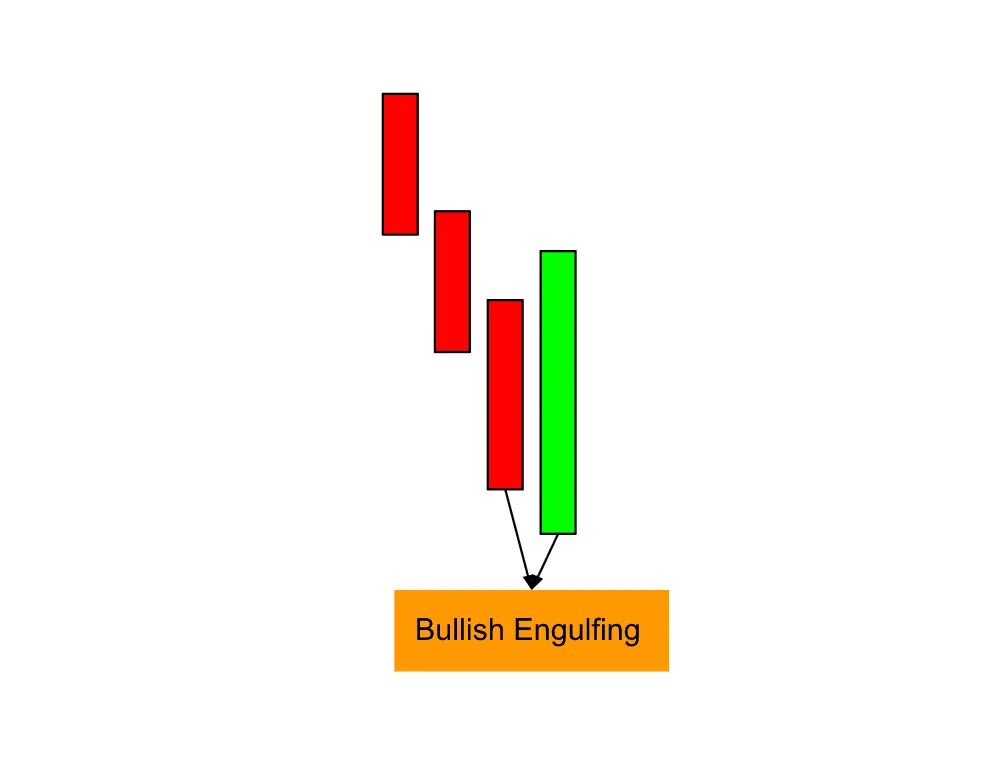
A Bullish Engulfing Candle is a two-candle reversal pattern that appears after a downtrend.
Here’s what happens:
- Day 1 (Bearish Candle): The stock closes lower, showing sellers are still in control.
- Day 2 (Bullish Candle): The next day, the candle opens below the previous day’s close — but buyers step in and push the price much higher, closing above the previous day’s open.
That means the second candle’s body completely engulfs the first candle’s body — hence the name.
It’s a visual sign that momentum may be shifting from sellers to buyers.
📈 What It Tells You
This pattern signals a potential bullish reversal.
It suggests that:
- Sellers tried to push prices lower but failed.
- Buyers stepped in aggressively.
- Market sentiment might be turning upward.
It’s especially meaningful if it forms at:
- A major support zone
- After a prolonged downtrend
- With higher-than-average volume
🔍 How to Identify It on a Chart
To spot a Bullish Engulfing Candle:
- Look for two candles near the end of a downtrend.
- The second candle should:
- Open below the previous day’s close.
- Close above the previous day’s open.
- Ideally, the candle body should be large and decisive.
(Imagine a small red candle followed by a big green one that completely wraps around it.)
How Traders Use It
Here’s how traders often act on it:
- Entry: When the next candle confirms by staying above the Bullish Engulfing Candle’s close.
- Stop-loss: Just below the low of the red engulfed candle.
- Target: Near recent resistance levels or based on risk–reward ratio (1:2, for instance).
For confirmation, many traders also check:
a) RSI bouncing from oversold zones.
b) Volume spikes on the engulfing day.
c) Support/resistance alignment.
⚠️ A Word of Caution
Not every Bullish Engulfing Candle leads to a big rally.
False signals happen — especially during sideways markets.
Always combine it with other factors like volume, trendlines, or moving averages before taking a trade.
🧠 Example (In Simple Terms)
Imagine a stock has been falling for several days.
Yesterday it closed at $81 after opening at $90 — that’s a red (bearish) candle.
Today, it opens at $79 but then rallies strongly, closing at $103.
You now have a Bullish Engulfing Candle — a big green candle that wraps around yesterday’s red one.
That’s your hint: buyers are stepping back in.
SPY — Case Study
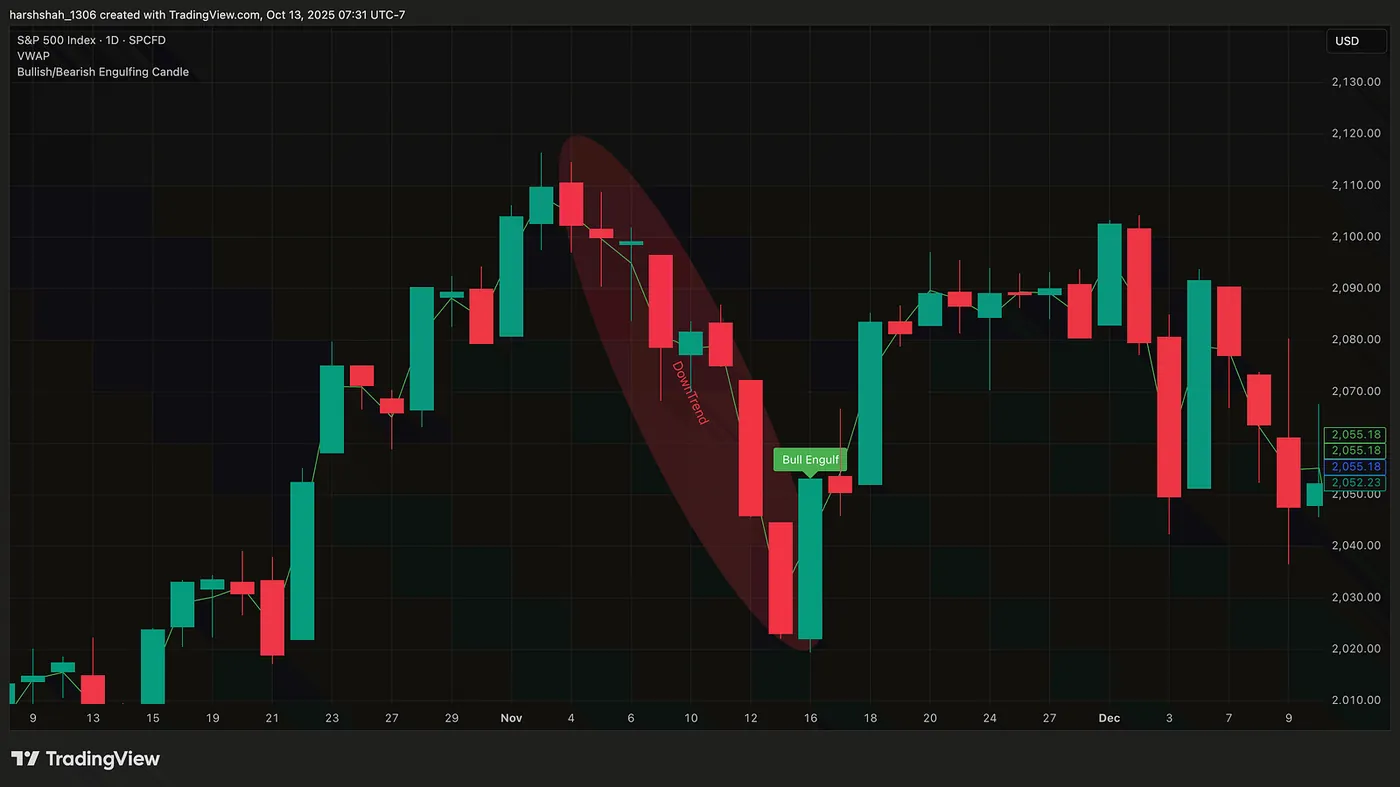
In November 2015, a bullish engulfing candle followed a downtrend, signaling a momentum shift that triggered a new uptrend.
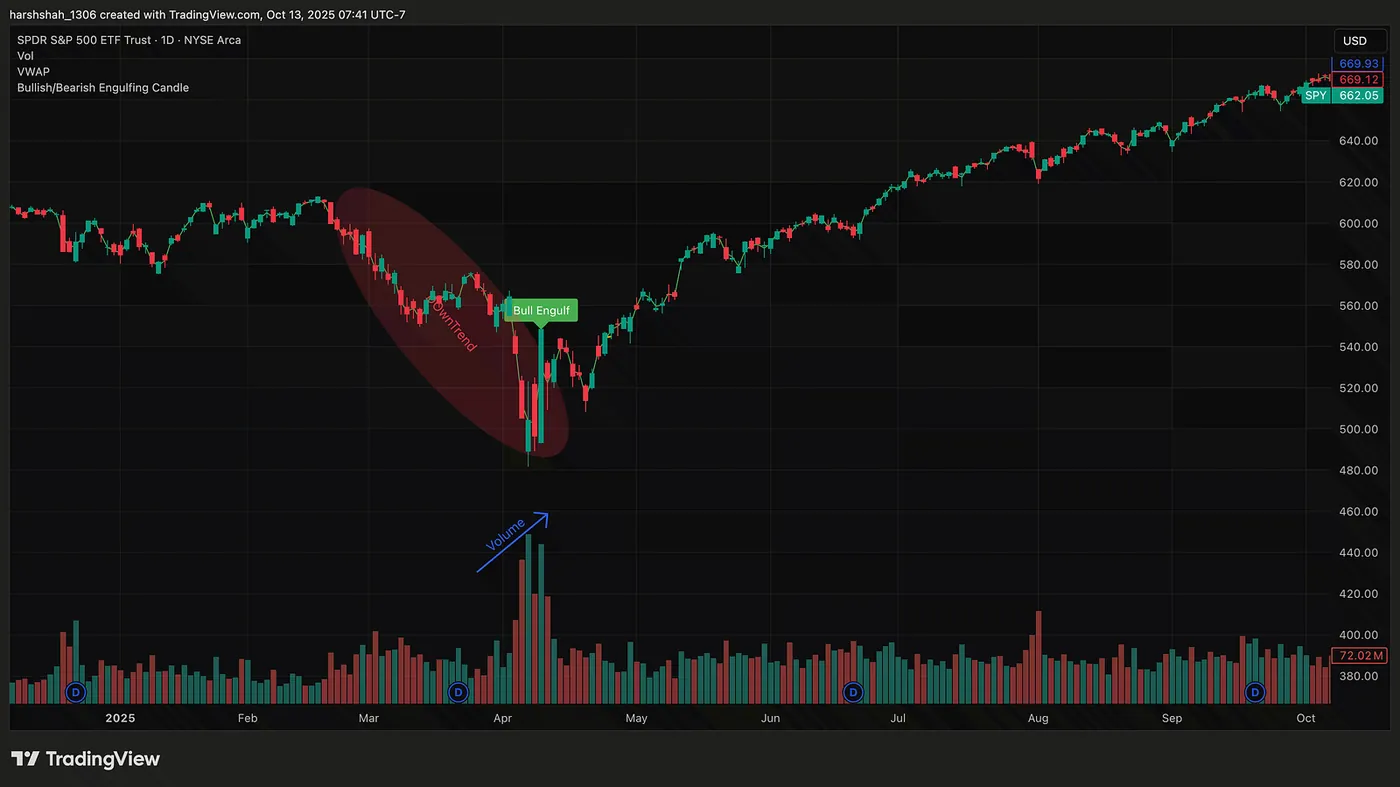
SPY — April 2025 (Tariff Lows)
A sharp downtrend was followed by a bullish engulfing candle that formed on increased volume.
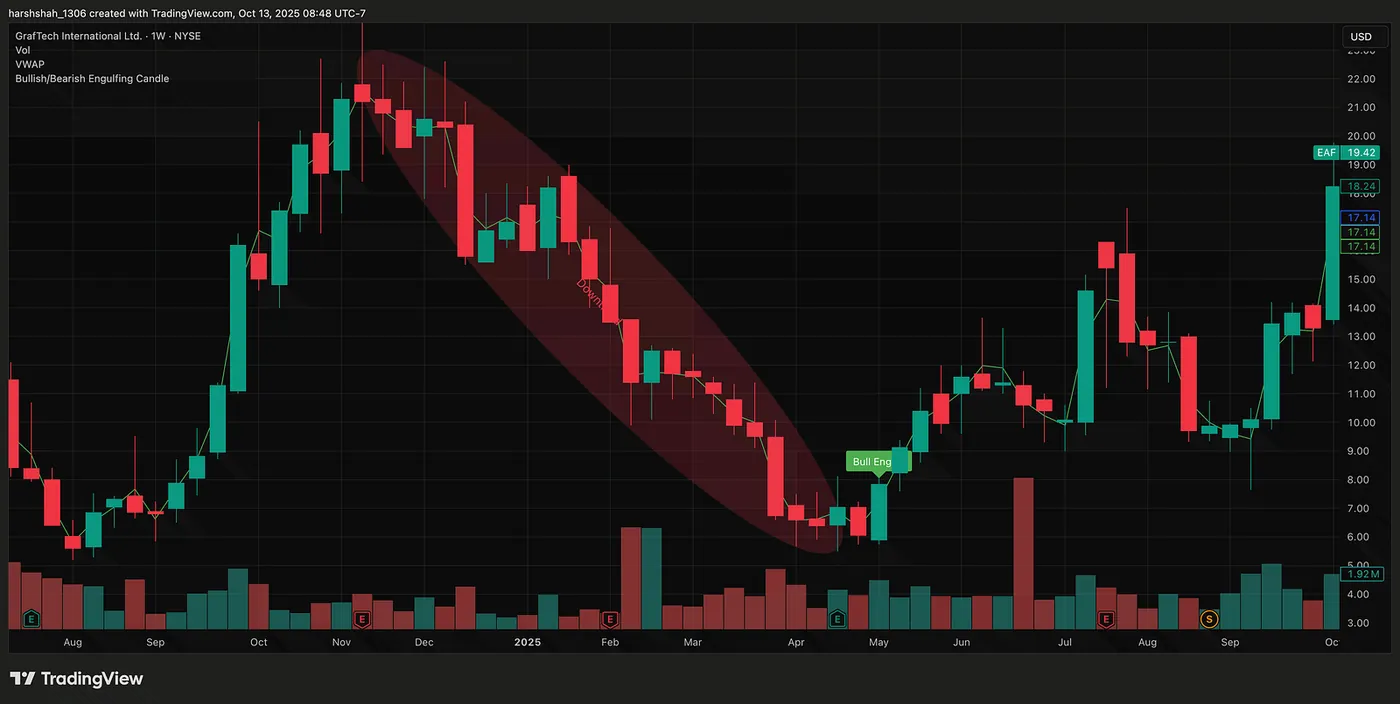
GrafTech Technologies (EAF)
Following a sharp downtrend, the stock formed a bullish engulfing candle — signaling a reversal that led to a 150% surge from its lows.
🪄 Final Thoughts
The Bullish Engulfing Candle is one of the simplest yet most reliable reversal signs on a chart.
It doesn’t mean “buy blindly,” but it does tell you something important: the tug of war between bulls and bears might be changing sides.
If you learn to read it in context — especially near strong support zones — this single pattern can often give you an early edge before the crowd catches on.
I’m creating a full technical analysisseriesthat breaks down chart patterns — from consolidations and wedges to breakouts and reversals — using real-world examples.