Understanding the Cup & Handle Pattern
I spotted Gold +45%, Silver +67%, Robinhood +87% rally — Another Stock Is Doing It Now 🚀
By Harsh Shah · Updated
Disclaimer: This information is for educational purposes only and should not be considered financial advice.
Have you ever looked at a stock chart and thought, “Wait… is that a teacup?” 😄
You’re not seeing things! That’s the Cup and Handle, one of the most classic breakout patterns in trading. It signals a potential pause… right before a major move up.
Don’t believe it? Look at the receipts:
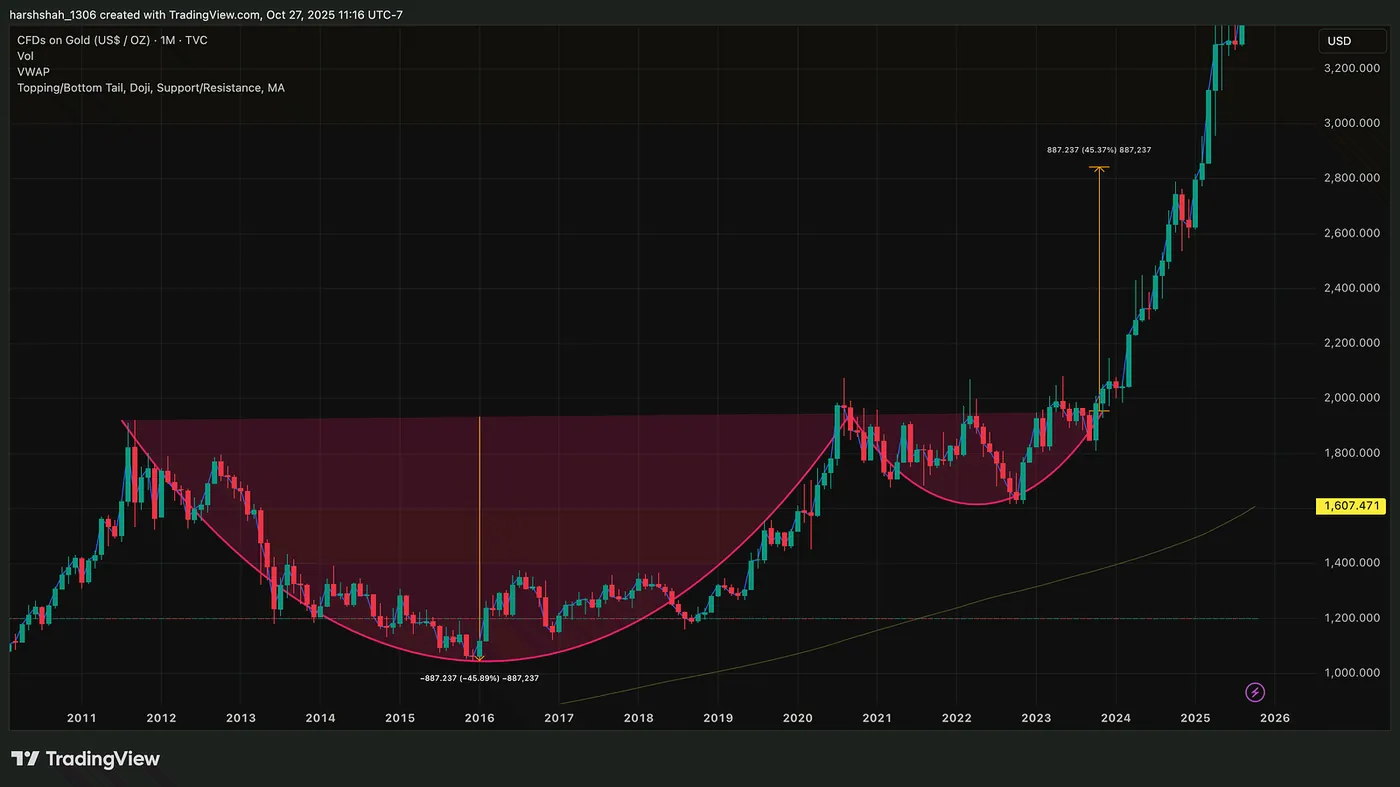
- GOLD: Brewed up a 45% gain after the pattern.
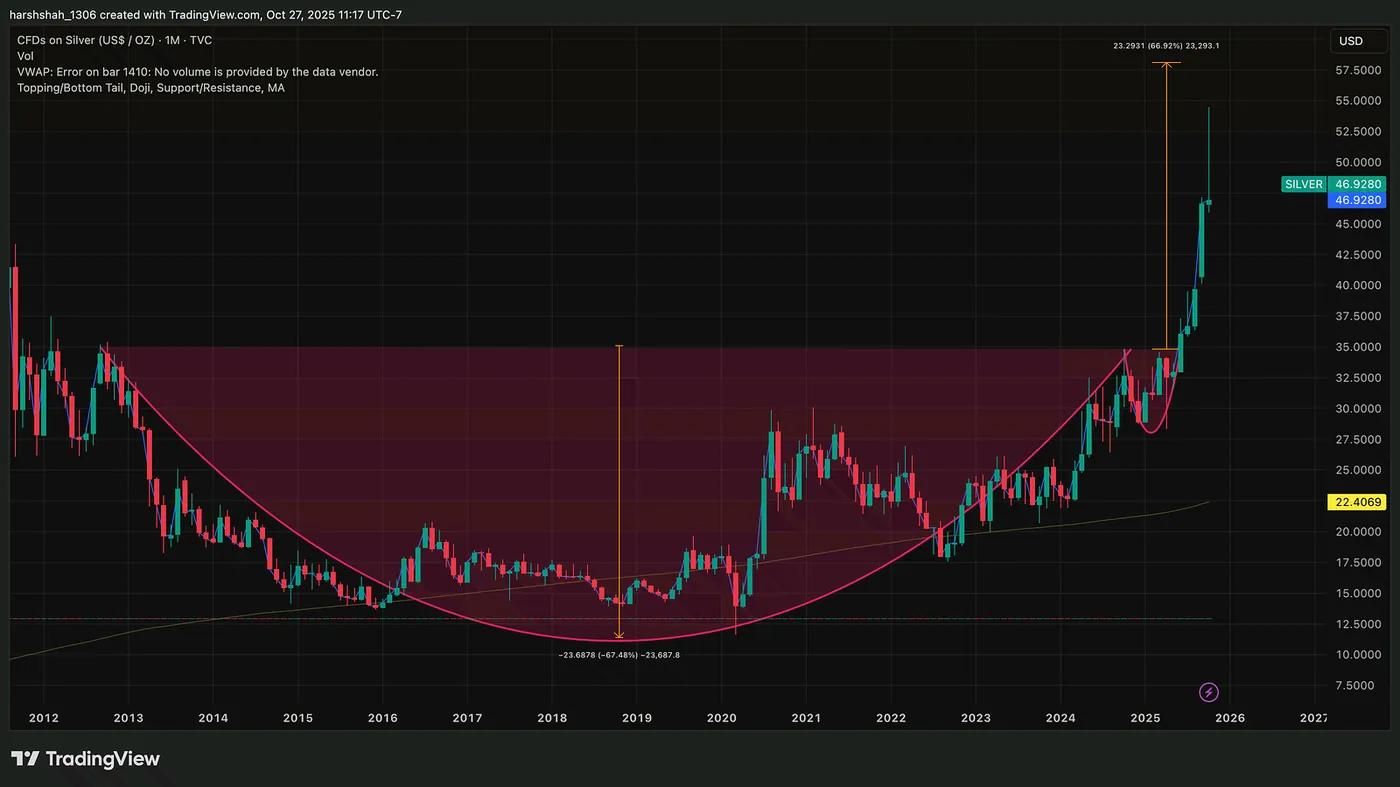
- Silver: Served up a hot 67% gain post-breakout.
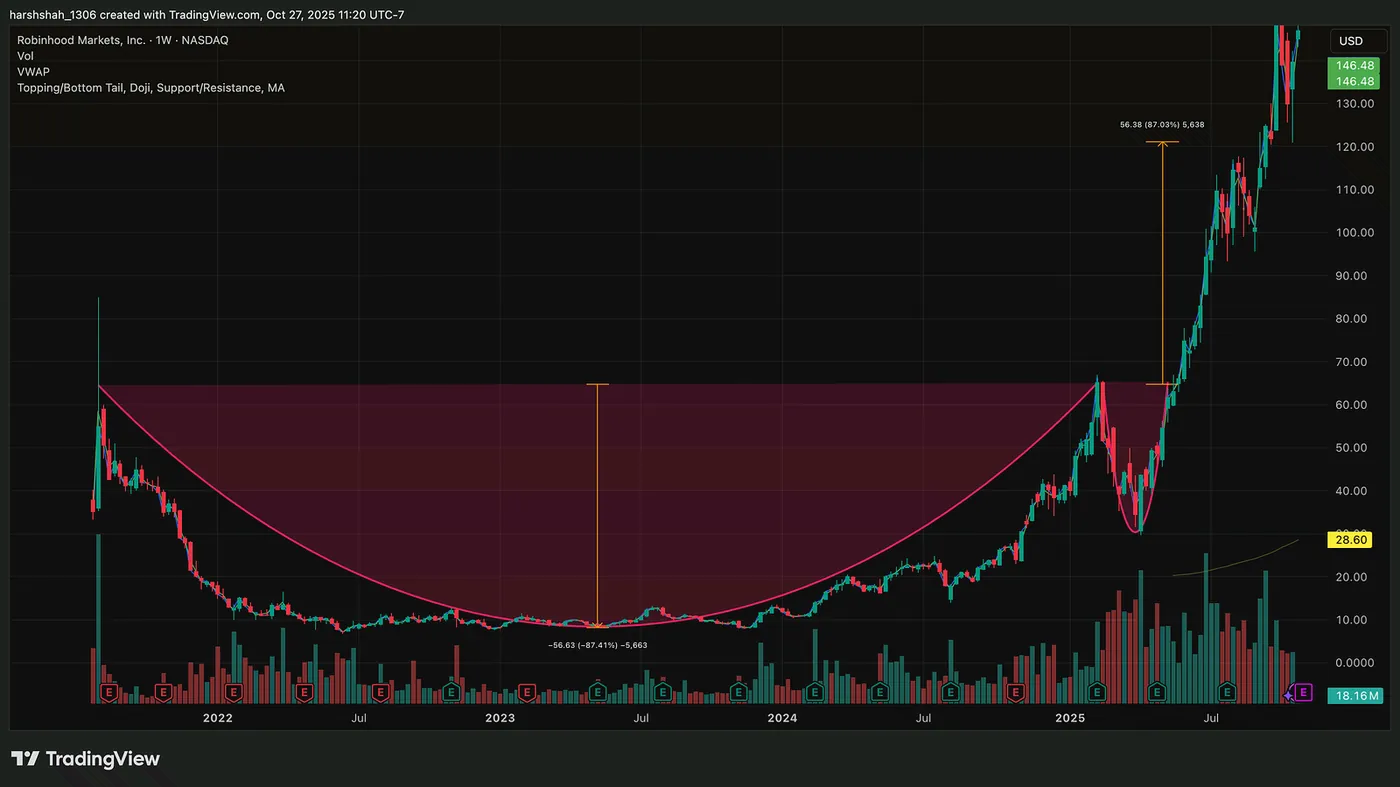
- Robinhood: Exploded 88% after the breakout
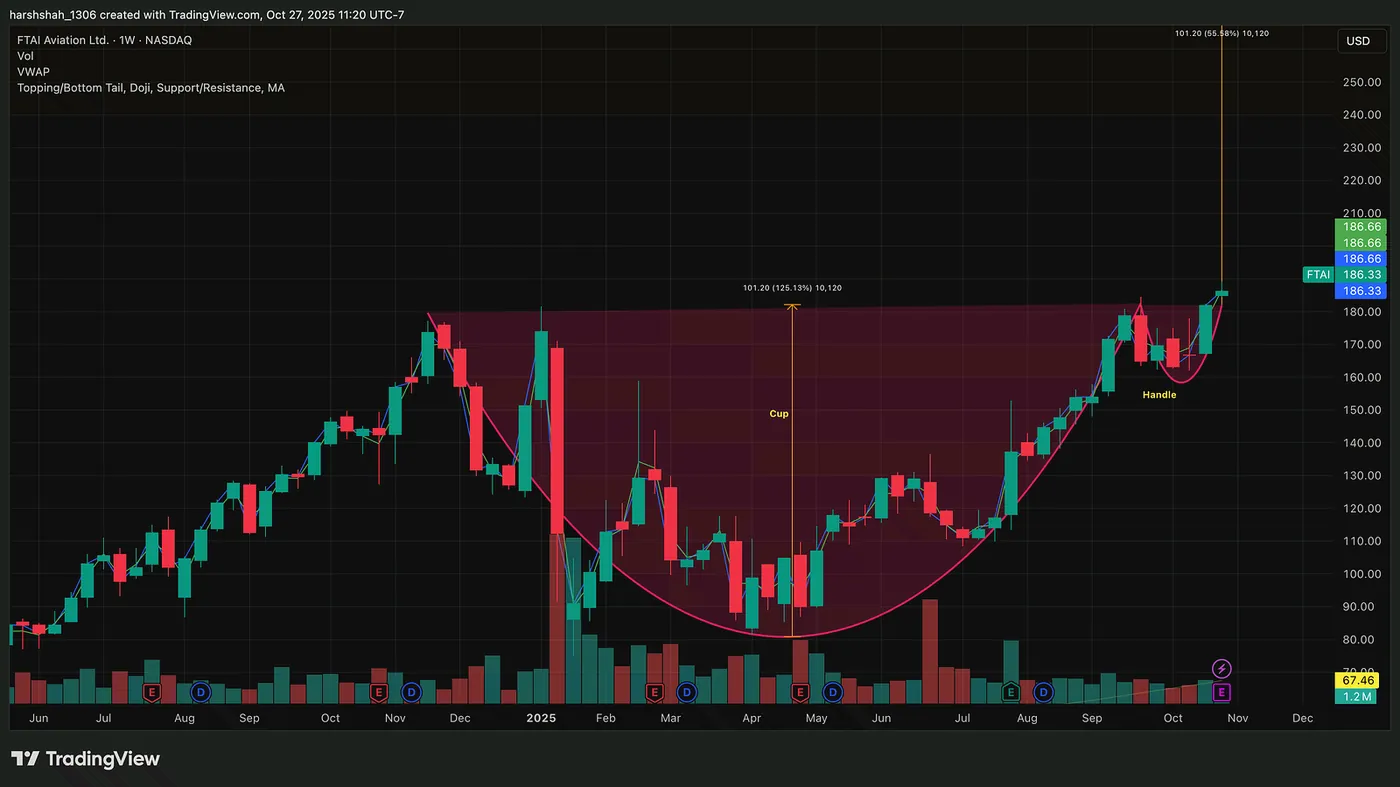
What’s Brewing Now? FTAI is forming this exact pattern today. If it plays out, it could be looking at a 55% upside.
So, what is this pattern, and how do you trade it? Let’s break it down simply.
The Cup and Handle Pattern
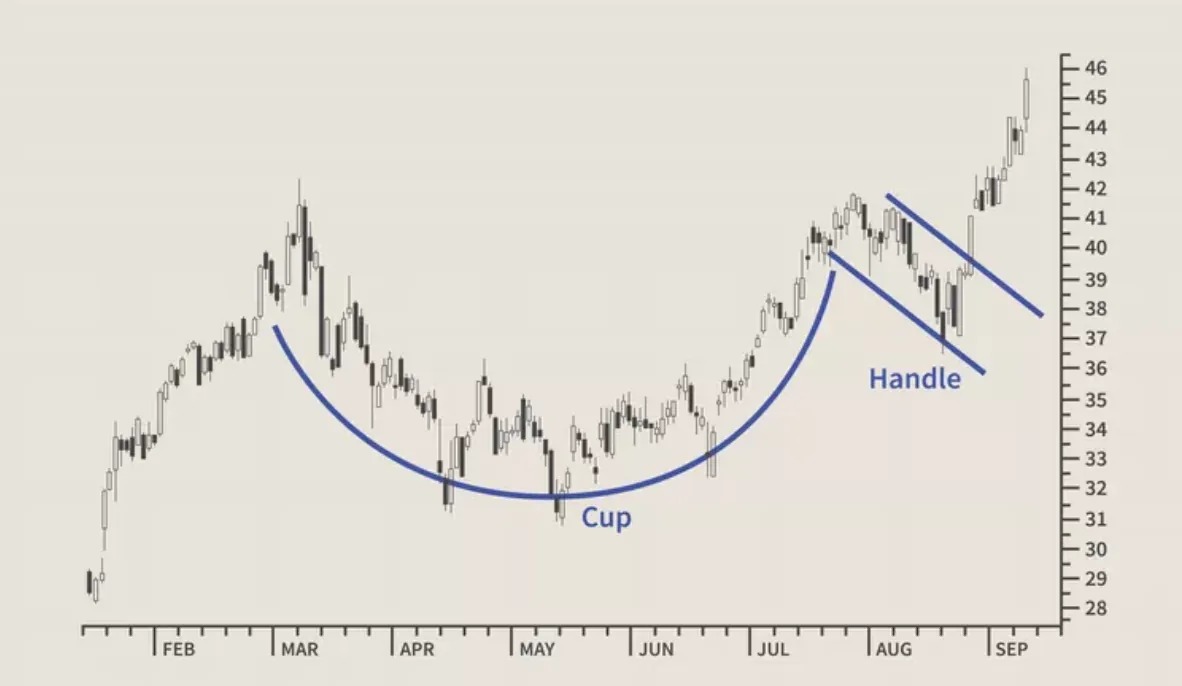
The Cup
Imagine the stock falls, then slowly recovers — forming a nice U-shaped base.
It tells you the stock went through a healthy correction — sellers were in control for a bit, but buyers gradually stepped back in.
It’s not a “V” shape crash-and-bounce.
It’s more of a smooth “U”, showing stability returning.
The Handle
Once the stock nears its previous high, it often pulls back slightly.This small dip forms the handle — like the final pause before a breakout.
This handle usually tilts a bit downwards or moves sideways — showing short-term profit booking before the next leg up.
The Breakout
Now comes the best part — When the price breaks above the handle’s resistance, that’s your breakout signal.
Volume should ideally pick up too — confirming that real buying interest is coming in.
Traders often consider entering here, aiming for a move roughly equal to the depth of the cup.
📊 Reading the Cup & Handle Setups
While this setup looks promising, analyzing the risk:reward ratio and setting a stop loss are paramount.
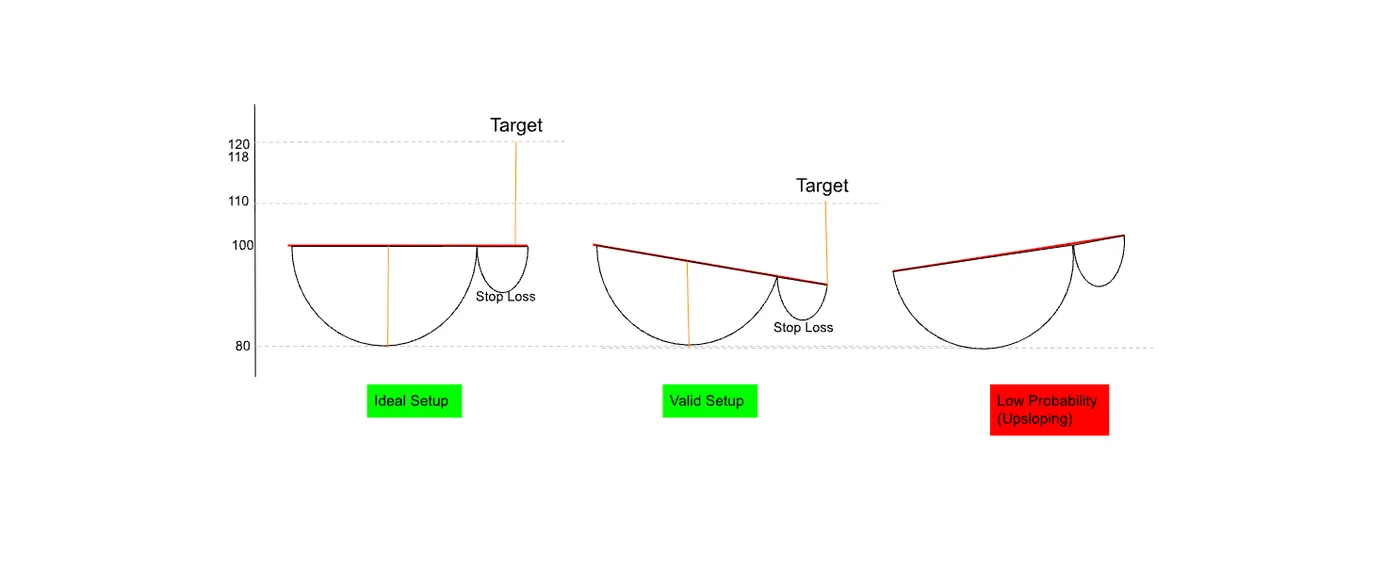
1️⃣ Ideal Setup (Horizontal Resistance)
Flat resistance — cleanest breakout and highest probability. Textbook perfection.
2️⃣ Valid Setup (Downsloping, ≤45°)
A gentle downtrend line is fine — shows healthy consolidation before the move.
3️⃣ Low Probability (Upsloping)
Handle rising upward? Skip it. It often signals weak consolidation and fake breakouts.
🎯 Target:
Measure from the bottom of the cup to the resistance — project that height upward from the breakout point.
🛑 Stop Loss:
Placed just below the handle’s low — if price breaks below it, setup invalidates.
Now, lets take a look at some real world examples:
GOLD — a 45% move
Following the breakout, GOLD experienced a significant rally, achieving its 45% price target within just a few months
SILVER: A 66% upside (in Play)
A similar setup is forming in Silver, which is still in play and targeting 66% potential upside.
Robinhood — a 87% Upside
Robinhood had a similar setup and has already completed its 88% move.
FTAI — A 55% Upside (potential Breakout)
This stock is on the verge of a breakout. A decisive move higher on significant volume would confirm the pattern, indicating a potential 55% upside.
⚠️ A Few Things to Keep in Mind
- A too long handle might mean momentum is fading.
- Volume confirmation is key — no volume, no conviction.
Final Thoughts
The Cup and Handle is one of those patterns that reminds you — the market isn’t just numbers, it’s psychology.
The cup shows recovery — buyers slowly returning after fear fades.
The handle shows hesitation — a quick pause before confidence builds again.
And the breakout? That’s when belief turns into action. 🚀
You don’t need to overcomplicate it.
Just remember: patience in the cup, discipline in the handle, and conviction at the breakout.
Like any setup, it’s not magic — but when combined with good risk management and volume confirmation, it can be a powerful tool in your trading toolkit.
Keep it simple.
Keep it structured.
And most importantly — keep learning with every chart you see.