The One Candle That Called Google’s Top Before a 20% Crash
By Harsh Shah · Updated
Disclaimer: This information is for educational purposes only and should not be considered financial advice.
What if I told you that a single candle gave a strong indication that Google had likely topped?
Google rallied all the way to $403, and after earnings, it’s now trading around $327 — a decline of nearly 20%.
This is one of the reasons I love Technical Analysis.
Technical Analysis doesn’t predict the future with certainty. Instead, it helps us understand the probability of what the market is telling us today. Are buyers still in control? Or are sellers quietly stepping in? Is demand still stronger than supply?
Let’s walk through Google’s chart and understand the candle that warned us something had changed.
More importantly, you’ll see that this concept isn’t unique to Google — it’s a pattern that appears across markets over and over again.
The Topping Tail
Before we look at Google, let’s first understand the pattern itself.
A Topping Tail forms when a stock rallies aggressively during the day but gets sold off just as aggressively, causing the candle to close near its lows.
In simple terms, buyers pushed prices higher, but sellers completely overwhelmed that demand before the close.
The result?
Late buyers get trapped, while experienced market participants — often institutions — begin taking profits or even initiating short positions.
Key Characteristics of a Topping Tail
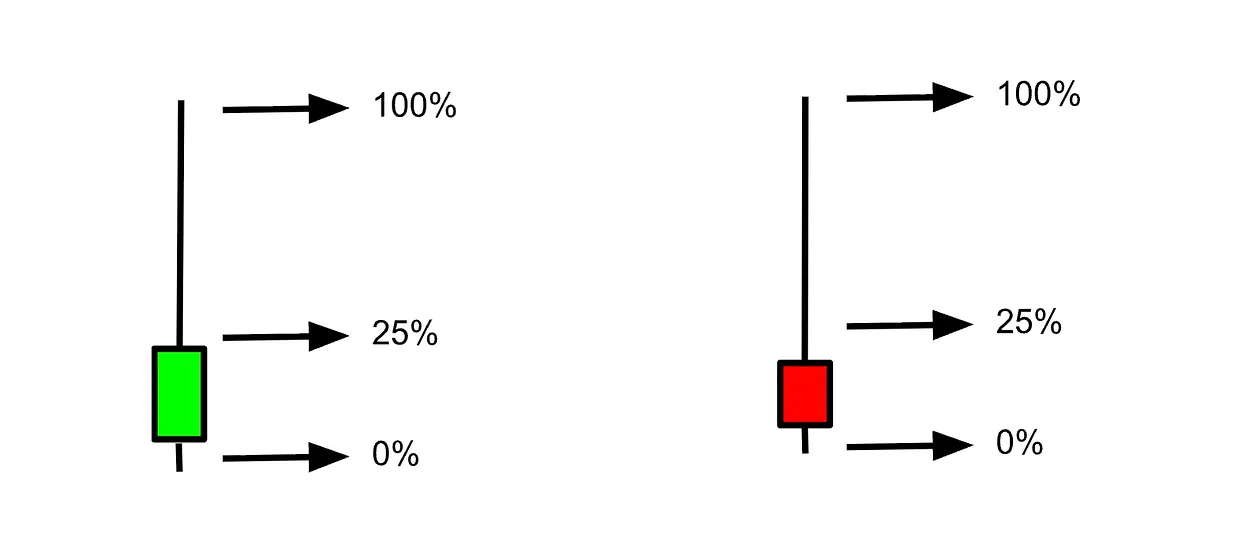
- Forms at or near a major pivot high (think: last 90 candles).
- The candle should be large in size — one of the largest in the past 30 candles — reflecting significant intraday action.
- The tail (wick) is at least 50% of the total candle length, showing a rejection of higher prices.
- The body of the candle is in the lower 50%.
- The close is ideally in the bottom 25% of the entire candle.
This formation tells us that buying pressure is drying up at elevated levels and bearish momentum is likely to follow.
The Psychology
The tail shows buyers tried to drive the stock higher, but sellers were strong enough to resist and push the price back down.
It reflects a shift in control — from exuberance-driven buying to confident profit-taking and selling. That’s why traders see it as a potential sign of reversal: the exhaustion may be setting in, and supply is overwhelming demand.
Google’s Topping Tail
On May 26, 2026, Google printed a textbook Topping Tail right around the psychologically important $403 level.
That wasn’t necessarily a signal that the stock would immediately collapse.
Instead, it suggested that the stock had likely become extended and needed to cool off.
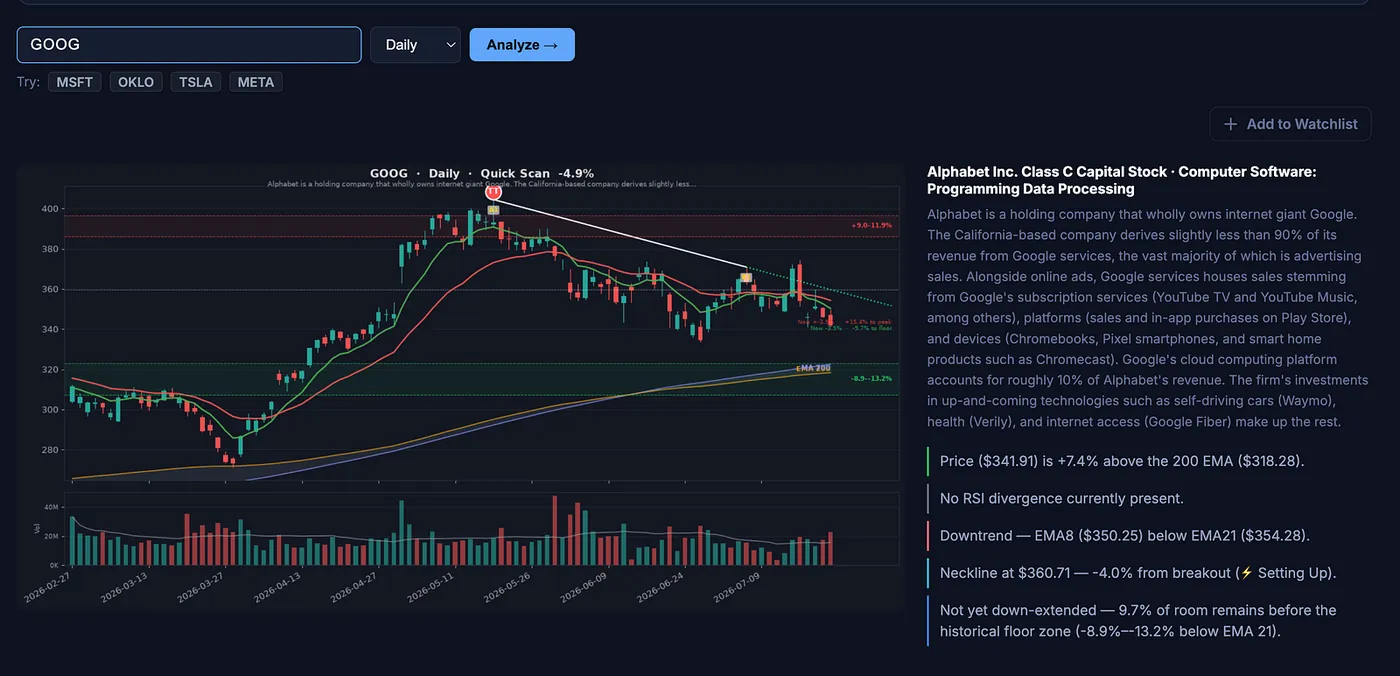
Fast forward to today, and Google has fallen nearly 20%, trading around $327 after earnings.
Technically, it now appears to be approaching an important support zone around $320, where multiple moving averages (EMA/SMA) are converging.
It’s Not Just Google
This pattern isn’t limited to mega-cap companies.
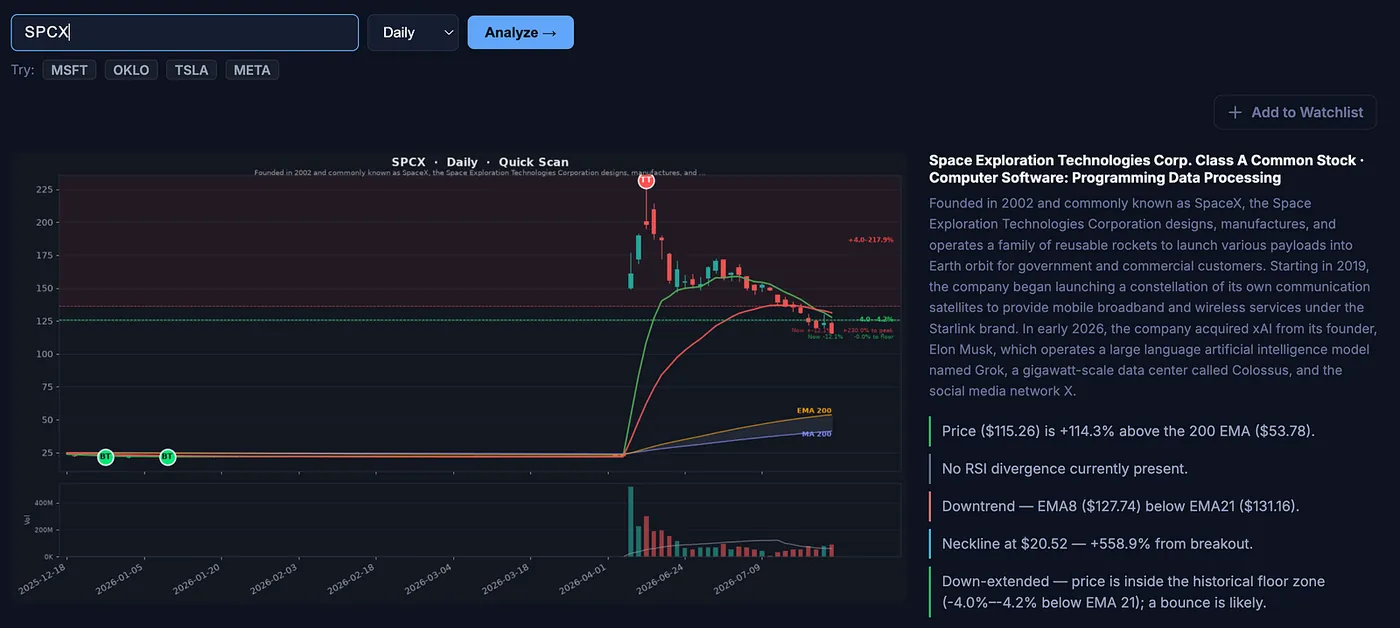
Take SpaceX, for example.
It also formed a nearly identical Topping Tail around the $225 level before beginning a significant reversal.
Today, it’s trading around $125.
Different company.
Different industry.
Same market psychology.
That’s the beauty of Technical Analysis. Human behavior doesn’t change, which is why these patterns continue to repeat across different stocks, sectors, and market environments.
Other Setups forming it today (from my scanner)
Here’s the exciting part.
I don’t manually search through thousands of charts looking for these setups.
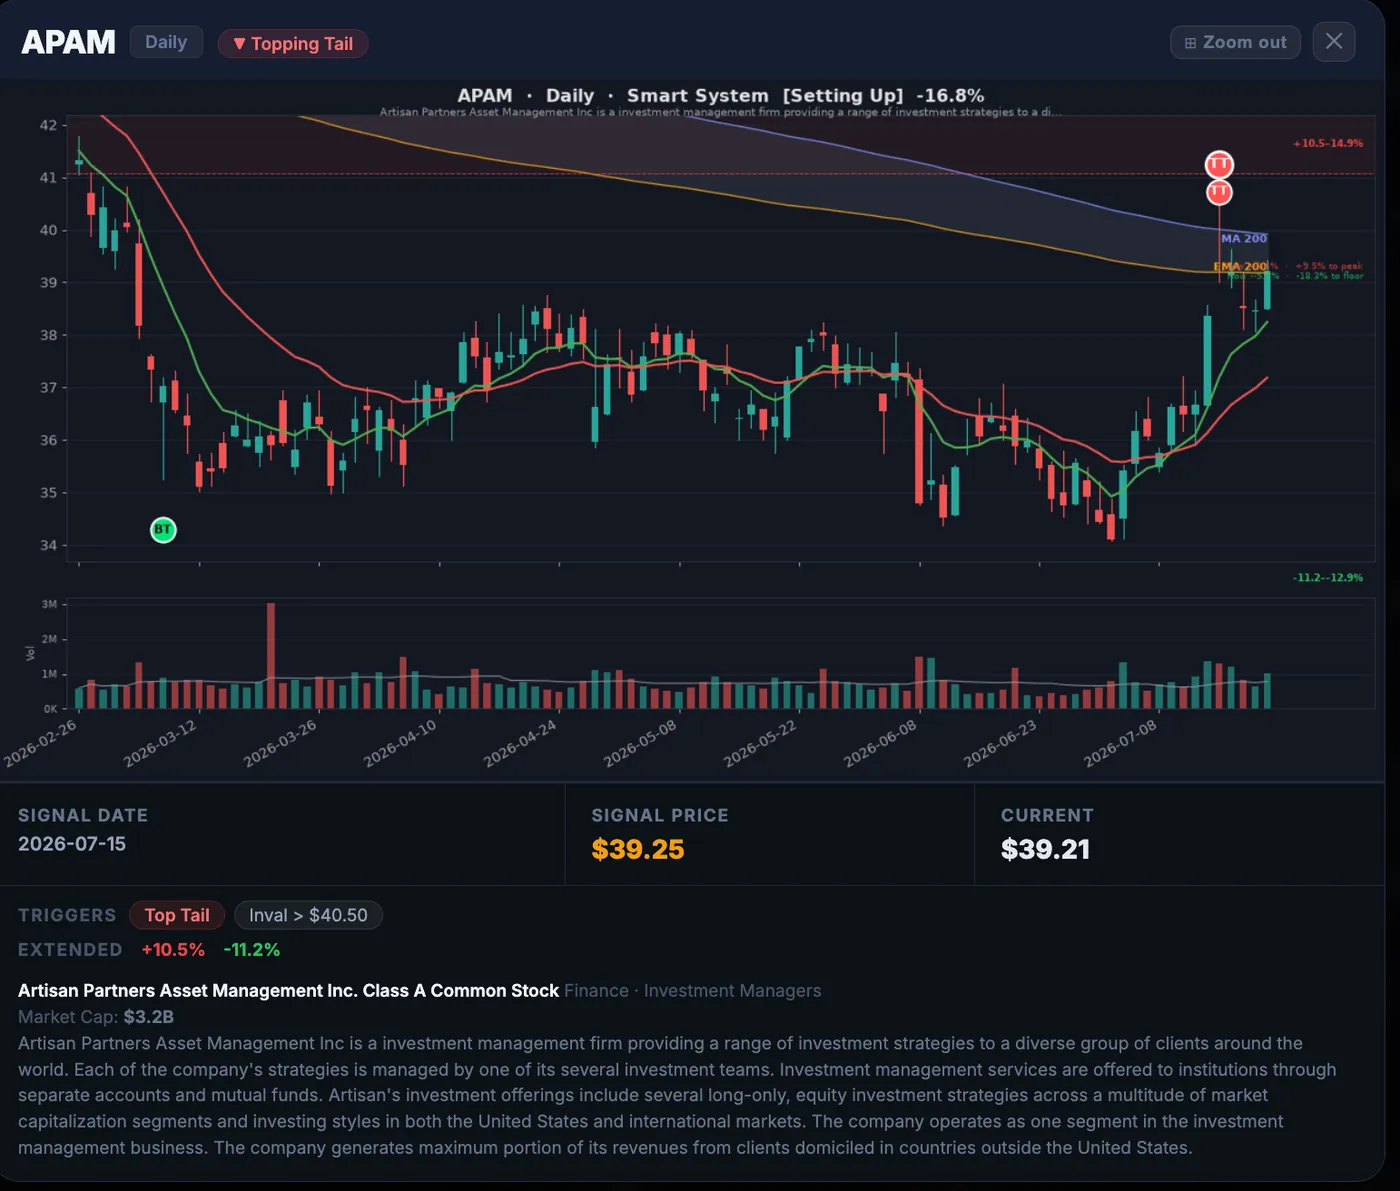
My scanner has strict rules programmed specifically to detect high-quality Topping Tail formations.
Whenever a stock meets those conditions, it automatically flags it for review.
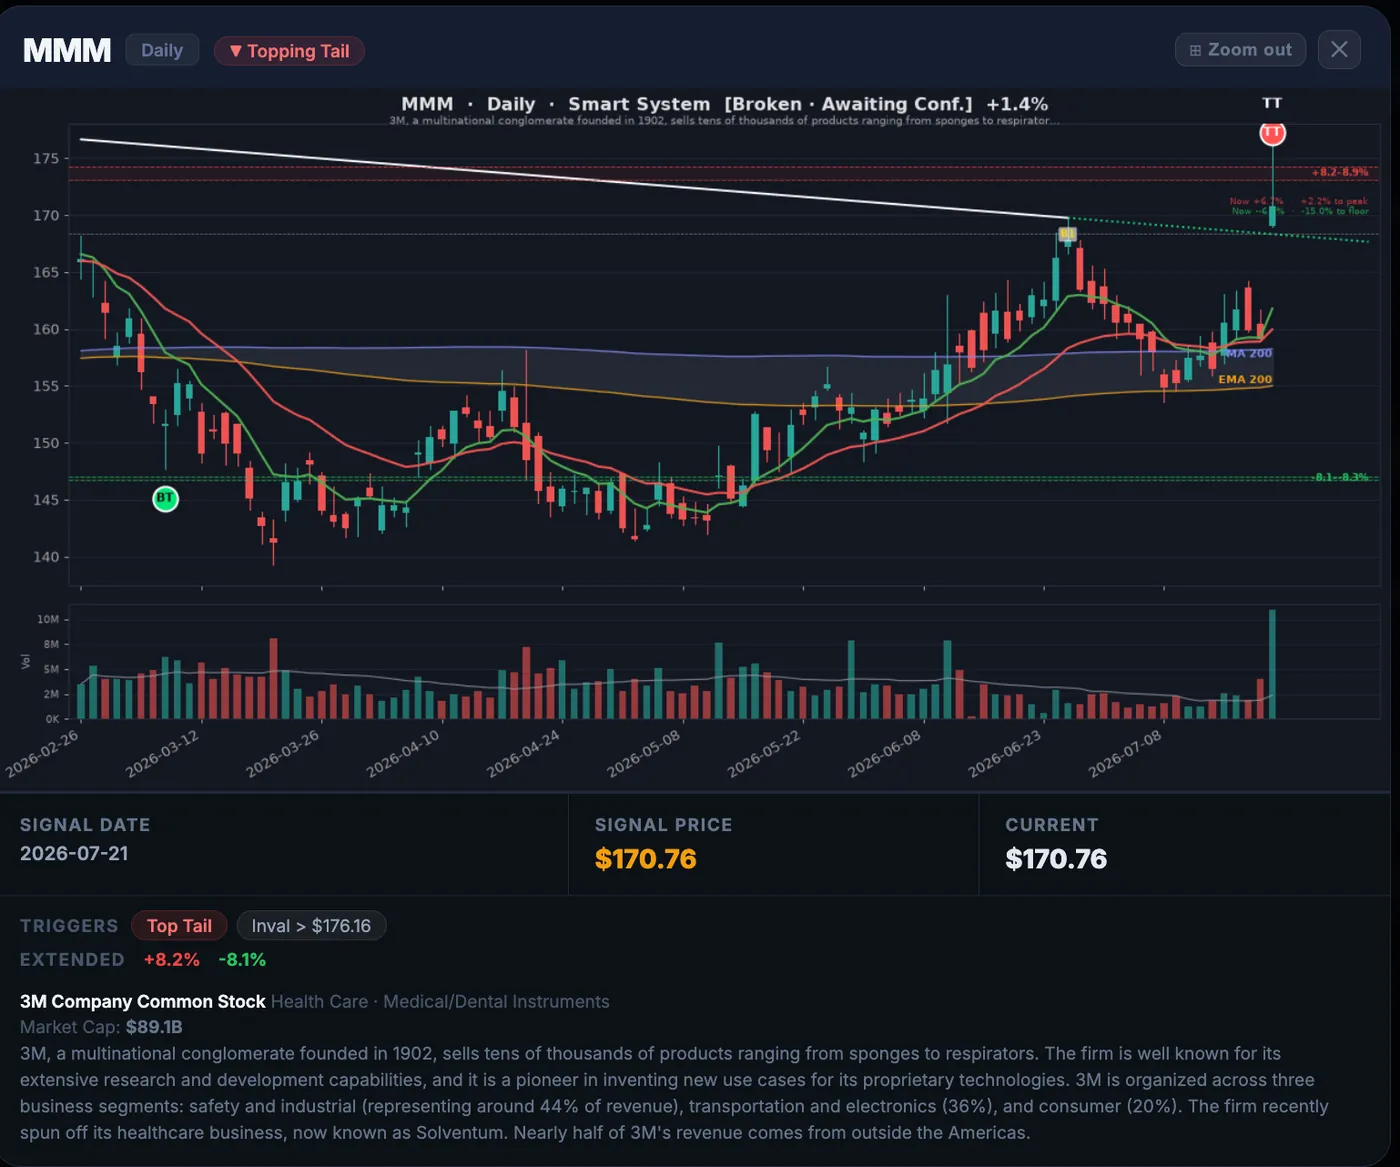
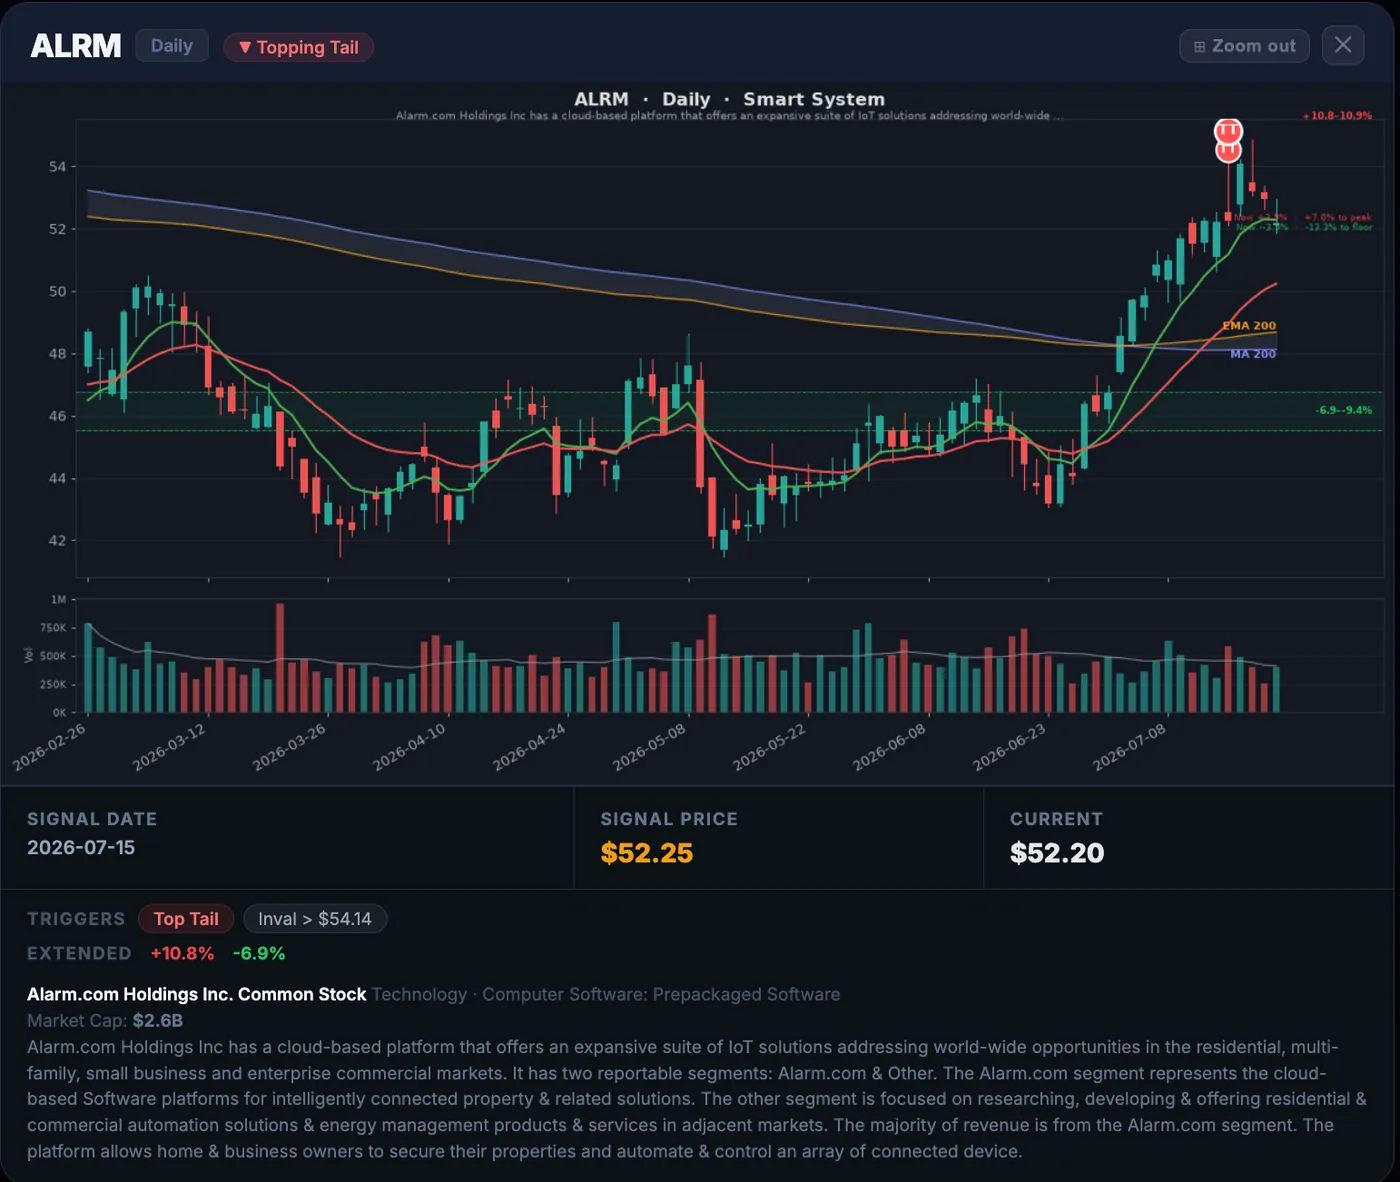
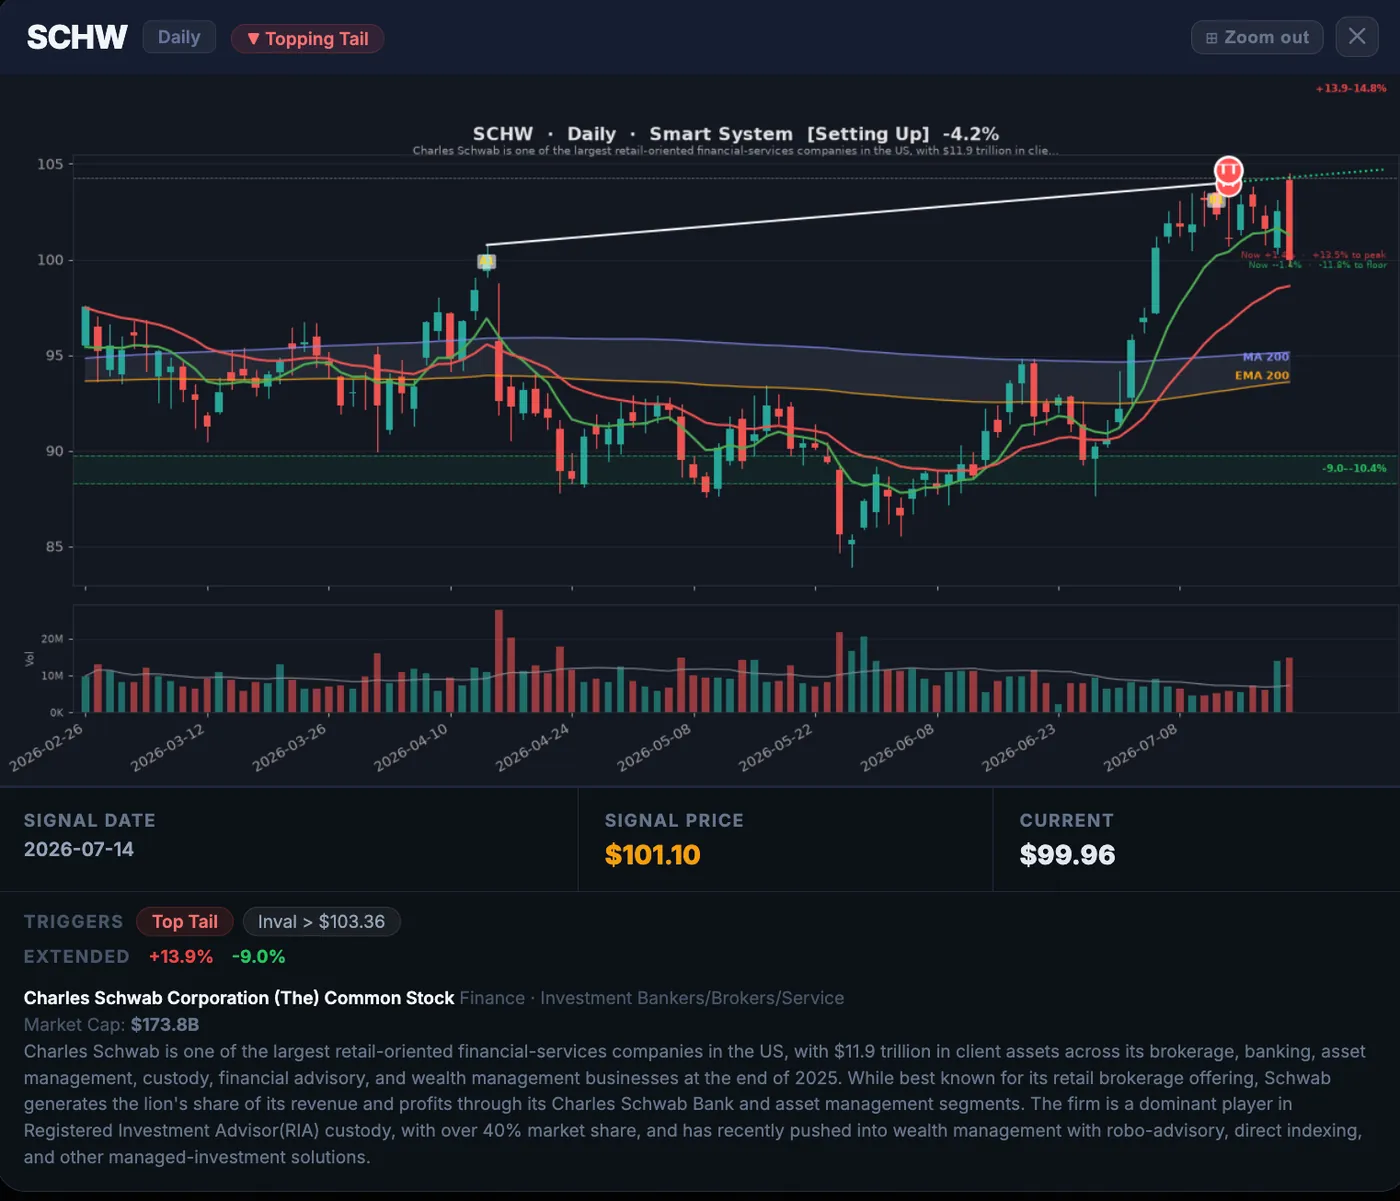
Here are a few recent examples where the scanner identified this pattern in action
Want Access to the Scanner?
The screenshots above are from the scanner I’m currently building.
I’ve been programming the Technical Analysis concepts I use every day into it, so instead of manually searching through thousands of charts, it automatically surfaces stocks that match my predefined criteria.
The goal is simple: spend less time scanning and more time analyzing high-quality setups.
Don’t Trade a Topping Tail in Isolation
One important thing to remember is that a Topping Tail should never be traded in isolation.
No single candlestick pattern guarantees a reversal. Instead, it should be viewed as one piece of the bigger Technical Analysis puzzle.
I like to combine it with other factors, such as:
- Major support and resistance levels
- Trend direction
- Volume confirmation
- Moving averages (EMA/SMA)
- Overall market conditions
- Risk-to-reward opportunities
When multiple technical factors align, that’s called confluence — and that’s when the probability of a successful trade increases.
Technical Analysis isn’t about finding certainty. It’s about stacking probabilities in your favor.
Final Thoughts
The goal of Technical Analysis isn’t to predict every move perfectly.
It’s to understand what the market is telling you right now and use that information to make better, more informed decisions.
Google’s Topping Tail didn’t guarantee a 20% decline — but it was an early warning that buying pressure was fading and sellers were beginning to take control.
Patterns like these appear repeatedly across different stocks because market psychology doesn’t change. Fear, greed, profit-taking, and supply versus demand continue to drive price action, regardless of the company.
The more you study these patterns and combine them with sound risk management and other technical concepts, the more confidence you’ll build in reading charts.
Remember, the objective isn’t to be right every time.
The objective is to consistently put the probabilities in your favor.