Understanding the Parallel Channel
I invested 15000$ in Tesla at 385$ — Here’s Why
By Harsh Shah · Updated
Disclaimer: This information is for educational purposes only and should not be considered financial advice.
Markets don’t move randomly.
They move in structures.
One of the cleanest and most reliable structures on a chart is the parallel channel. No indicators. No fancy math. Just price respecting boundaries — again and again.
And when something keeps working repeatedly, it deserves attention.
Before I show you the exact Tesla setup, let’s understand the concept — so you can spot it instantly on any chart.
What Is a Parallel Channel?
A parallel channel forms when price moves between two parallel trendlines:
a) One acting as support
b) The other acting as resistance
Price oscillates between these two lines while maintaining a clear direction — either up, down, or sideways.
Think of it as price walking inside a corridor.
As long as price stays inside this corridor, the trend is intact.
Why Parallel Channels Work So Well
Parallel channels work for one simple reason:
👉 They reflect balance.
- Buyers step in at support
- Sellers step in at resistance
- Neither side is strong enough (yet) to break the structure
This balance creates predictability — and predictability is what traders are paid for.
The Psychology Behind Parallel Channels
- Pullbacks to support attract missed buyers, defended longs, and short covering — demand repeats
- Moves into resistance trigger profit-taking and hesitation — momentum slows
- This push and pull between fear and greed creates rhythm and repeatable price behavior
- When the balance breaks, stops trigger, emotions spike, and moves become fast and violent
This isn’t magic.
It’s human behavior on display.
The Real Edge: Defined Risk
The biggest advantage of a parallel channel isn’t prediction — it’s risk control.
When price is at:
a) Channel support → Risk is clearly defined just below support
b) Channel resistance → Risk is defined just above resistance
There’s no guessing.
No “hope trades.”
No emotional entries.
You either get the level right — or you’re wrong quickly.
That’s how professionals trade.
TSLA — A Deep Dive Into My Tesla Entry
October 1 — Tesla at $460
Tesla tagged the upper end of the channel near $460.
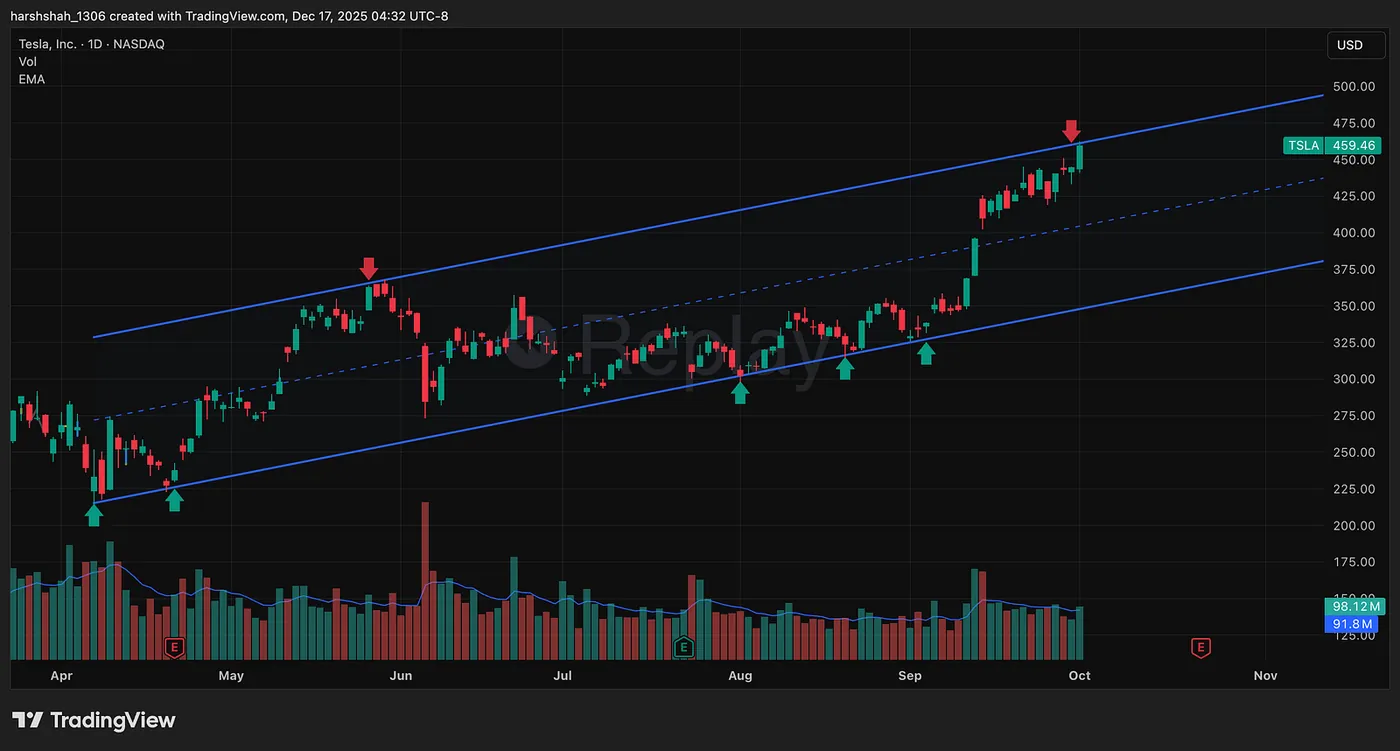
Did I buy there?
Absolutely not.
Instead, I waited.
Would price break the channel — or get rejected and rotate lower?
My plan was simple:
👉 I’d be interested only near channel support around $385.
Nov 21st — 51 days later
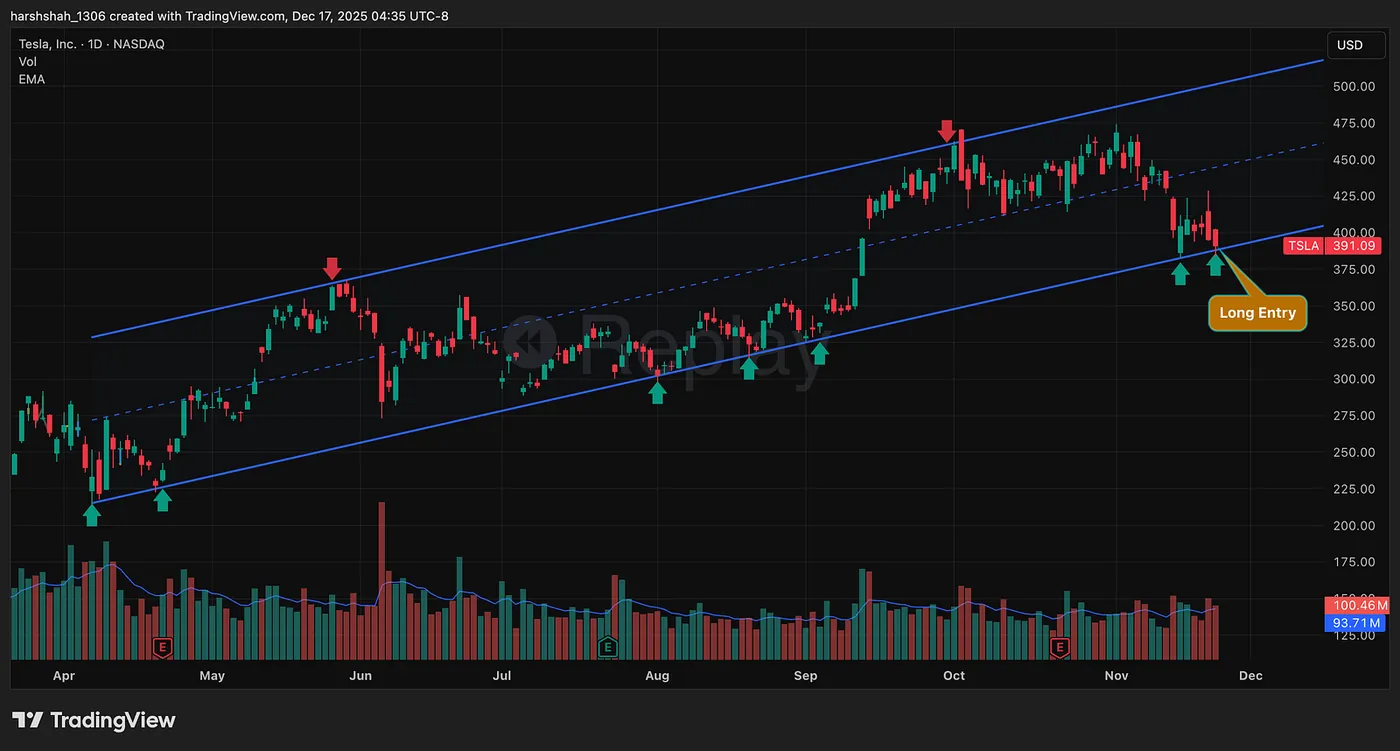
Tesla retraced to the lower boundary of the channel — I entered Long.
Fear was everywhere.
I didn’t panic.
I didn’t guess.
I used structure.
This was a swing trade, so my risk was clear:
Any confirming close below the channel was my stop.
Fast Forward to Today
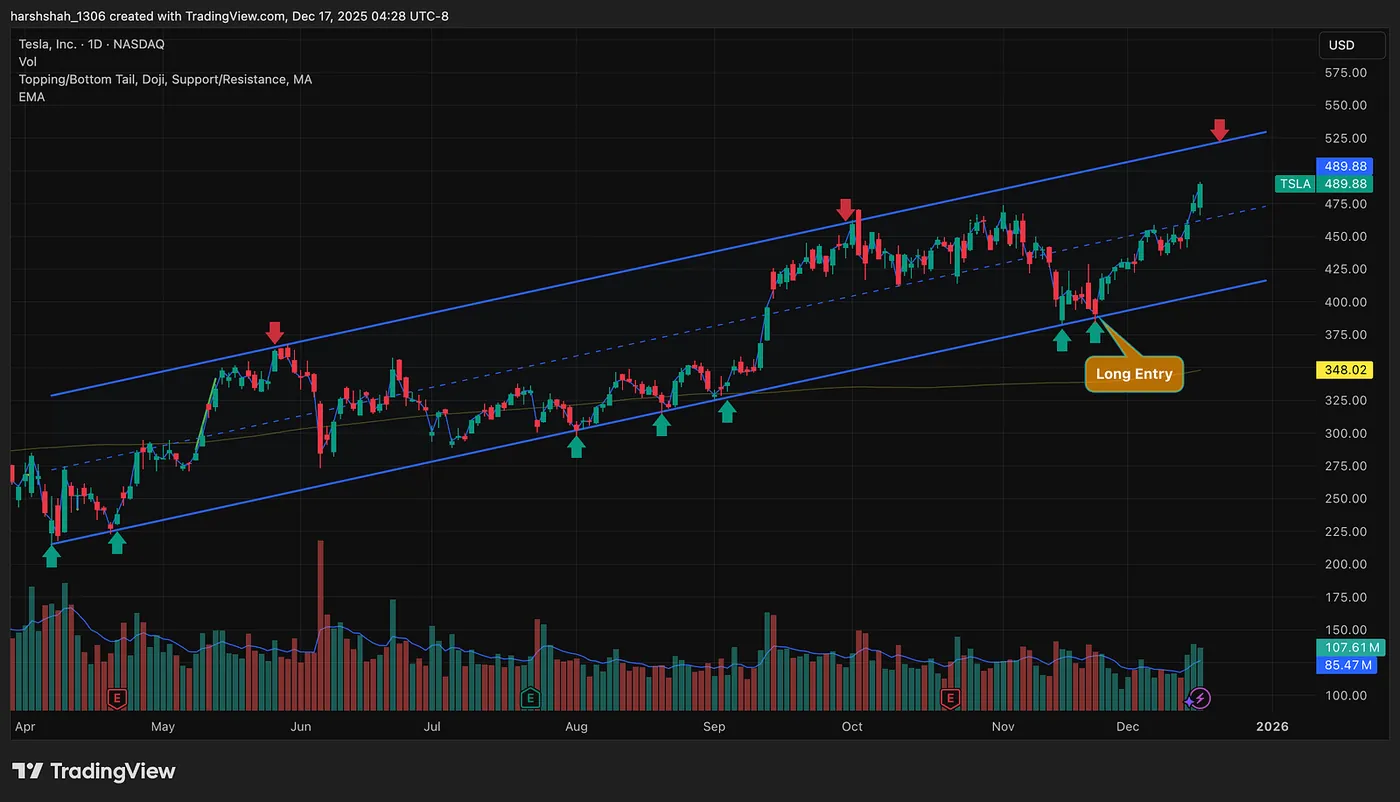
Price respected the channel.
Tesla bounced — and started moving back toward the upper end of the range.
This is exactly how parallel channels are meant to be traded.
They don’t predict tops or bottoms.
They keep you on the right side of the structure.
I regularly post these chart setups and send free alerts as new ones form.
👉 Explore them here: datadriveninvesting.io/chartsetups-us
It’s Not Just Tesla
AAPL —Price rejection near $287 made perfect sense at channel resistance
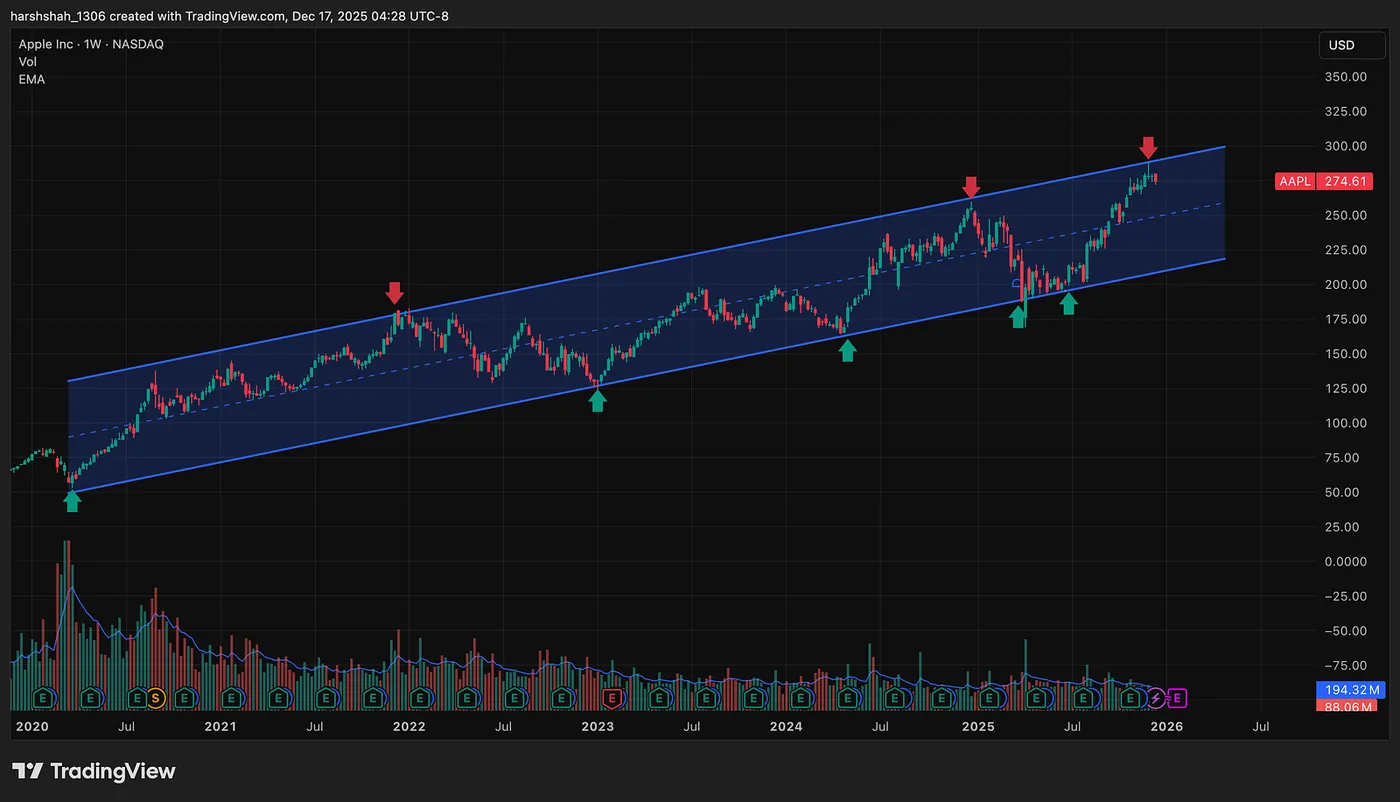
MSFT — The $550 rejection wasn’t random; structure did the talking
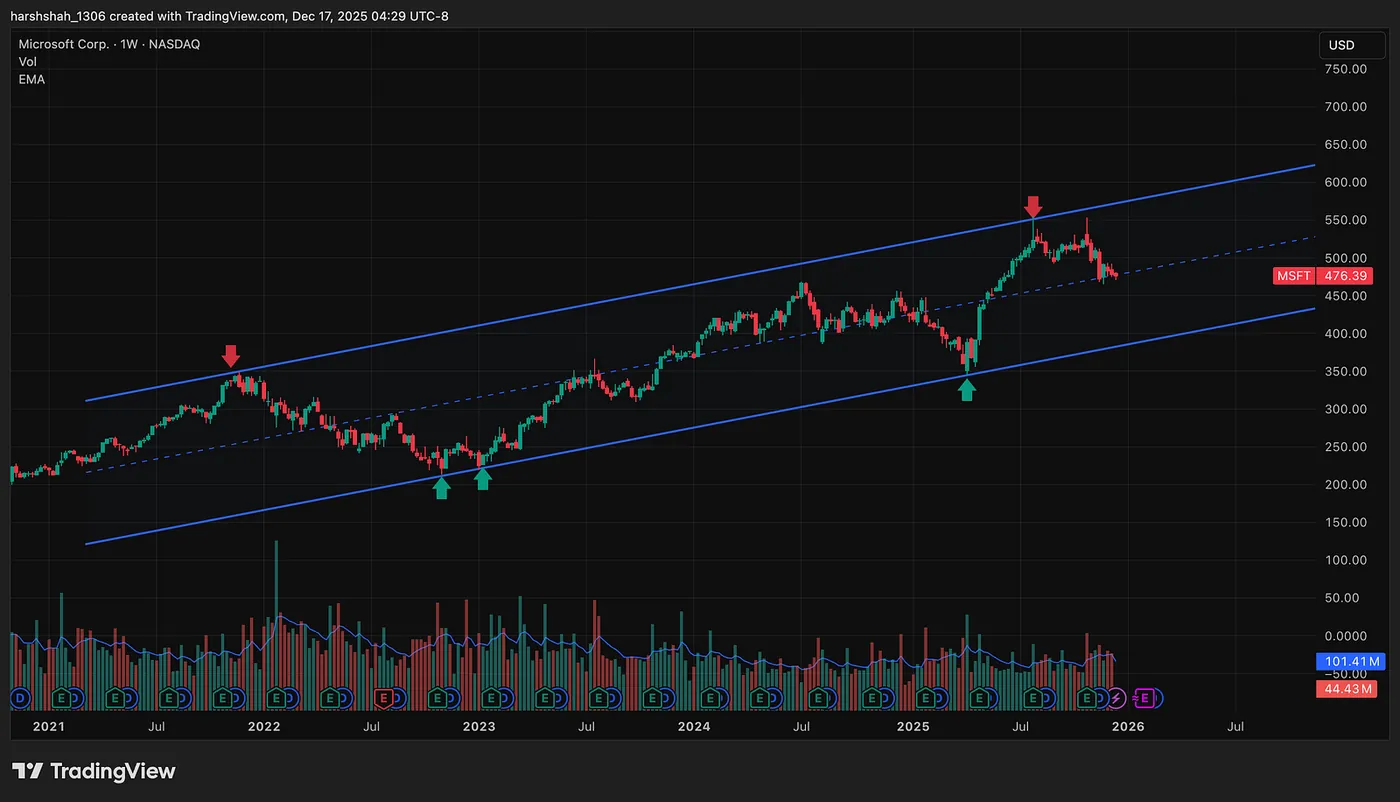
Once you start seeing channels, you can’t unsee them.
Final Thought
Parallel channels won’t make you rich overnight.
But they will:
- Keep you aligned with the trend
- Improve your entries
- Remove emotion from decision-making
And over time, that consistency compounds.
Trade the structure.
Respect the levels.
Let price do the talking.