Understanding the P/E Ratio
Why Amazon P/E was 0 in 2023 — the P/E Ratio Trap: Why Most Investors Read It Wrong
By Harsh Shah · Updated
Disclaimer: This information is for educational purposes only and should not be considered financial advice.
You’ve heard it all: “This stock’s P/E is 200!” …or “That stock’s a steal at a P/E of 10!”
The textbook move? Buy the 10, avoid/short the 200 one. But if trading/investing were that easy, wouldn’t we all be millionaires?
I’ve found the crucial missing piece about P/E… and it changes everything.
Before I explain the shortcoming of P/E ratio, lets first breakdown the core components of the P/E ratio i.e. Price and Earnings.
Understanding Earnings
The earnings show the public how much money a business “earned” or profited in the past three months (timeframe where every business is required to report earnings).
The Price to Earnings Ratio
P/E of 20 means
=> The price is 20 times the earnings for the current time period i.e. measures how much investors are willing to pay for $1 of a company’s earnings.
=> It will take 20 years to recoup the investments.
Price to Earnings (P/E) = Total Market Capitalization / Earnings.
Lets understand this with a simple example
The Candy business
Total number of shares in the market = 1000.
Price of each share = 10$.
Total Market Cap = number of shares x Price of each share = 10000$
Shares (also called stocks or equity) represent ownership in a company.When a company is divided into parts (like slices of a pizza), each part is called a share.
If you own one share, you own one part of that company.
Tom’s business is running fantastic and he is earnings money from 2 sources:
a) Core operations (Selling Candy)
b) Investments in AI business
Example 1
In the past quarter, Tom reported the following:
a) Core operations (Selling Candy): $1000
b) Unrealized loss in AI business investment: $500
Based on this calculation, the Price/Earnings ratio should be
P/E = 10000(market cap) / 1000(Earnings) = 10.
I.e. it would take 10 years for the business to return all the initial investments back to someone who invested today at 10 P/E.
But here is the twist:
From 2018, The GAAP (Generally Accepted Accounting Principles) said:
“Business now need to include unrealized gains and losses on investments towards their earnings”
So, instead of P/E being attractive at 10, it changes to:
P/E = 10000 / (1000–500) = 20.
The business now looks expansive at 20 P/E, but is it the true reflection of the candy business for this year?
Example 2
In the past quarter, Tom reported the following:
a) Core operations (Selling Candy): $1000
b) Unrealized gains in AI business: $1000$
Based on this calculation, the Price/Earnings ratio should be
P/E = 10000 / 1000 = 10.
But taking the unrealized gains into account, the P/E for this year becomes quite attractive.
So, instead of P/E being attractive at 10, it changes to:
P/E = 10000 / (1000+1000) = 5.
The business now looks cheap at 5 P/E, but is it the true reflection of the candy business for this year?
Lets now take a look at real world examples to illustrate this!
Amazon
Amazon is currently trading at a P/E of 35.50. Looking back in time, the P/E ratio of Amazon spiked to 0 => 309 in 2023.
Note: 0 P/E is reported when the companies earnings reported were negative.
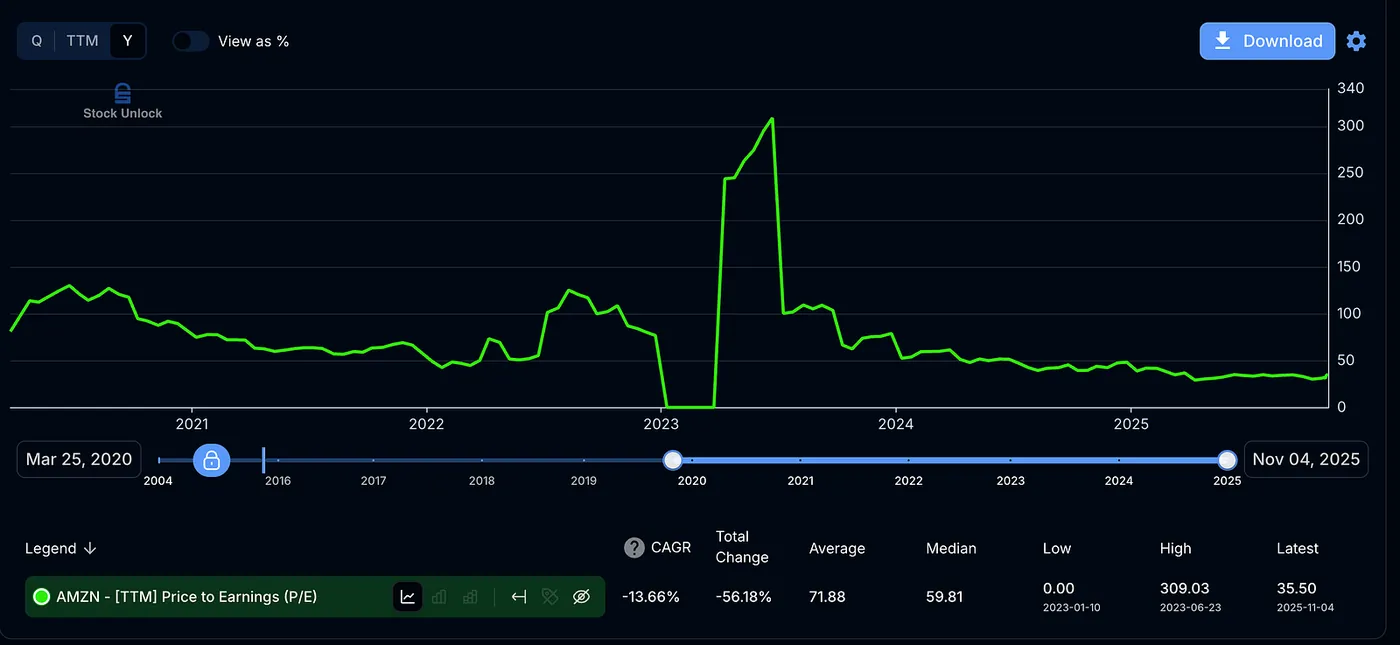
Do you really think Amazon was unprofitable? Not at all.
Amazon had invested billions in Rivian, and the fluctuations in that investment’s value temporarily distorted its earnings that quarter.
Did anything actually change in Amazon’s core business operations? No.
But someone looking only at the P/E ratio might wrongly assume the company is expensive or unprofitable — and decide to stay away.
Berkshire Hathway
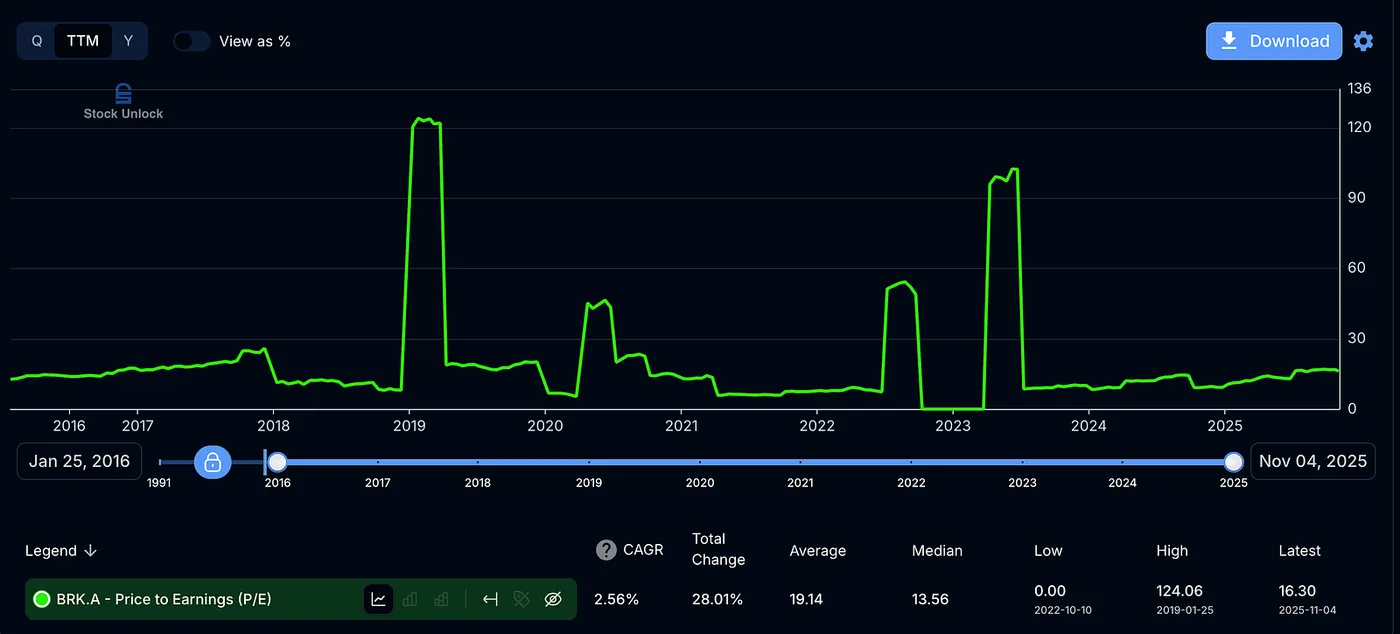
The same story applies to Warren Buffett’s investment firm.
Because of market volatility, its P/E ratio has swung from as high as 123 to as low as 0, and now sits around 16.3.
But did the business itself actually become more expensive? Not at all.
Buffett has consistently outperformed the S&P 500 for years. During this entire period, Berkshire didn’t even sell a single stock from its portfolio — meaning the unrealized gains and losses from its holdings distorted the P/E ratio, without reflecting any real change in the company’s performance.
If not P/E then what ?
Investing isn’t one-size-fits-all — the right metric depends on the type of company.
For growth companies, Price-to-Operating Cash Flow (P/OCF) works best, as it reflects cash generated from core operations.
For mature or non capital-intensive companies, Price-to-Free Cash Flow (P/FCF) is more useful, since it accounts for cash left after necessary investments.
To keep this blog concise, I’ll focus on the metric that best fits Amazon.
Note: We’ll dive deeper into the definitions and analysis of each metric in future blogs.
Amazon — Trading at ~20 P/OCF, Growing operating cash flow at ~22%
Using the P/OCF (Price-to-Operating Cash Flow) ratio is particularly insightful for evaluating Amazon.
Operating cash flow represents the cash a business generates from its core operations — before investing in capital expenditures (CapEx). In recent times, many companies have been heavily spending on data centers and growth initiatives, which can distort traditional valuation metrics.
By focusing on P/OCF, we get a clearer picture of the company’s true earning power from its core business. Interestingly, Amazon’s most recent P/OCF ratio was around 17, one of its lowest levels — which can be viewed as a potential support zone for long-term investors.
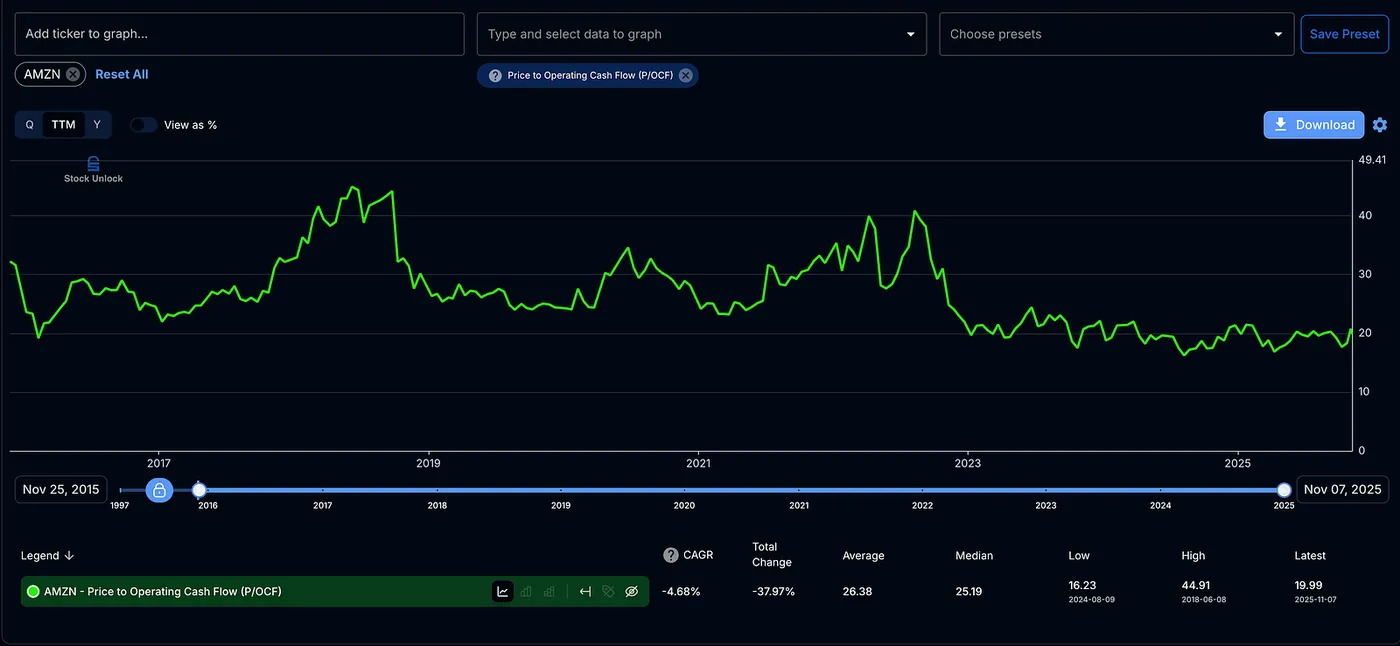
Note: Some business rely on P/E, P/FCF(Free Cash Flow), P/OCF, hence, there is no one size fits all when it comes to evaluating companies!
Final Thoughts
Next time you hear someone say, “The P/E looks expensive” or “This stock is cheap,” take it a step further — ask yourself whether the earnings truly reflect the real strength of the business or not.