Understanding Candlesticks
What’s a Candlestick? The Visual Language of Market Psychology
By Harsh Shah · Updated
Disclaimer: This information is for educational purposes only and should not be considered financial advice.
In the world of technical analysis, charts are our storybooks, and a candlestick is a powerful visual summary, a single chapter telling the complete tale of a stock’s price movements over a specific time period.
While this period can be a minute, an hour, a week, or a month etc. let’s focus on the daily timeframe to keep things simple.
Think of a candlestick as a quick report on a stock’s day. It shows you four things:
Open: The price at the start of the day.
High: The highest price it reached.
Low: The lowest price it went to.
Close: The price at the end of the day.
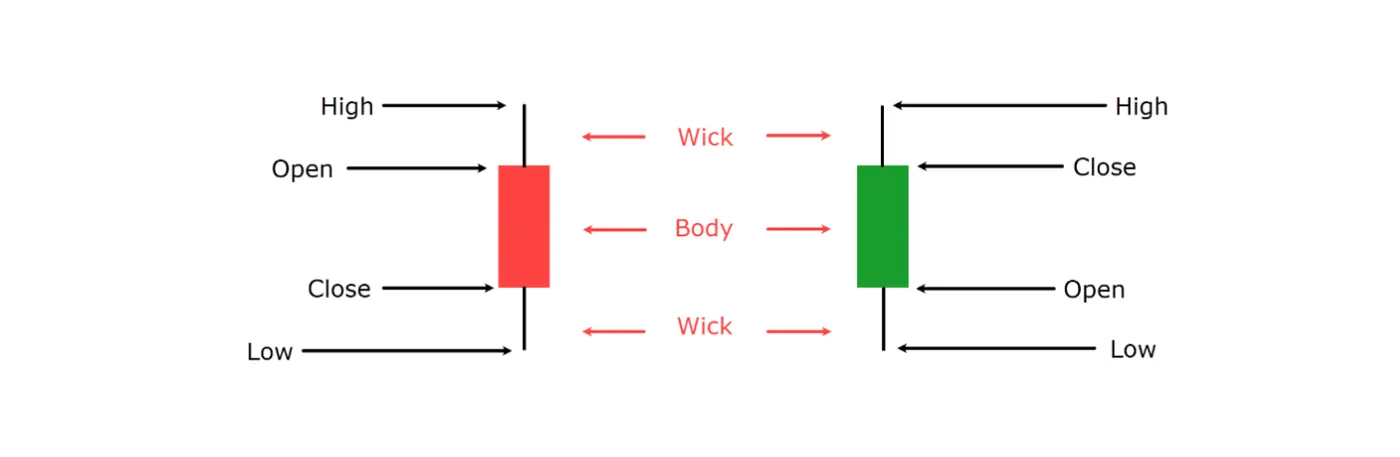
Green means the price went up for the day.
Red means the price went down for the day.
Instead of having to look at a list of numbers, a single glance at a candlestick tells you everything you need to know about the day’s price action. Was it a volatile day? Did the price end higher or lower than it started?
TimeFrames
Candlesticks are adaptable. A daily candlestick tells you what happened in a day, and a weekly one summarizes the whole week.
Your trading style should match your chart’s time frame.
Intraday traders use time frames less than a day.
Swing traders(Within 1-12 weeks) use daily or weekly charts.
Long-term investors use weekly or monthly charts.
Supply and Demand
Every candlestick is a direct visual of the battle between supply (sellers) and demand (buyers).
Green Candle: Demand wins! Buyers are in control, pushing the price higher. A long green body shows strong demand overpowering supply.
Red Candle: Supply wins. Sellers dominate, pushing the price lower. A long red body signals aggressive selling pressure.
Long Wicks: These tell a story of a failed attempt. A long upper wick means buyers tried to push the price up, but sellers flooded the market, pushing it back down. A long lower wick shows buyers overcoming sellers.
Ultimately, a candlestick is a snapshot of who is winning the supply and demand battle at any given moment. Reading them helps us predict who might take control next.
Let’s look at a real-world example to see how candlesticks connect to human psychology.
SMH (Weekly Chart)
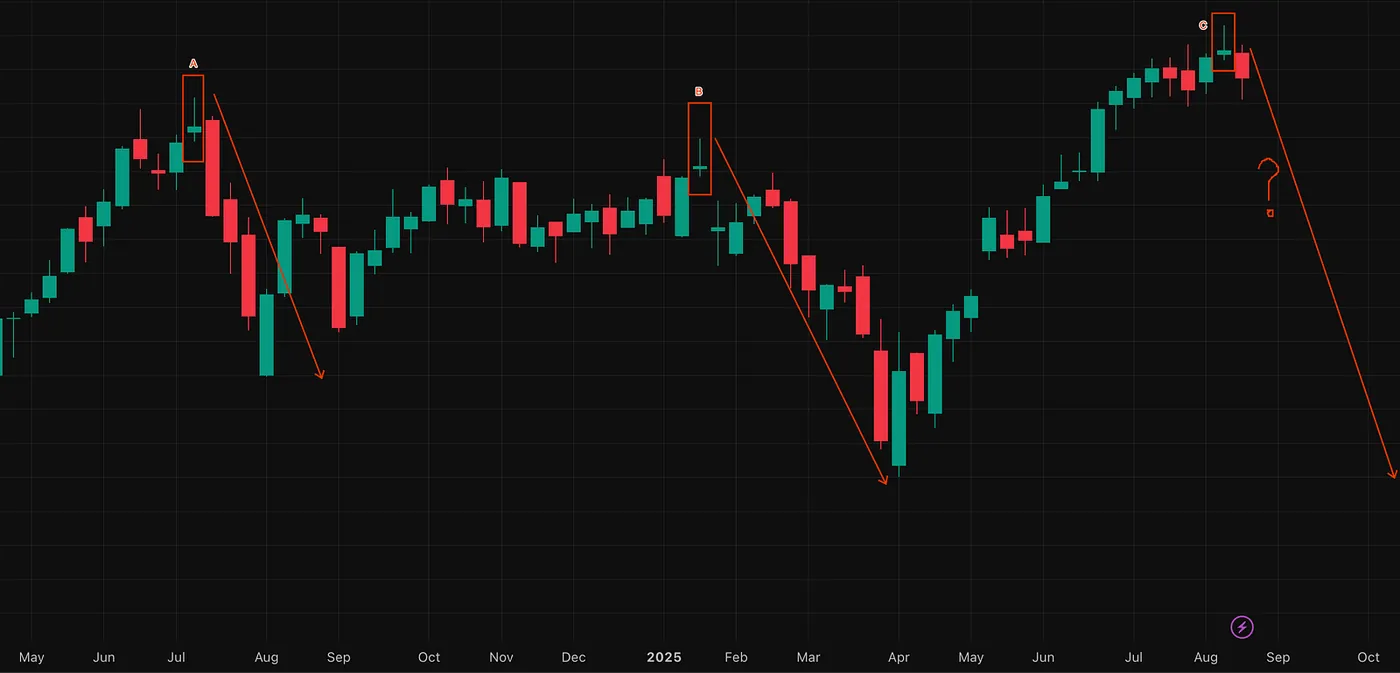
Note: We are using a candlestick type — Topping Tail(Shooting Star) to show how a single candlestick can reveal the psychology behind market movements. We will cover a full breakdown of different candlestick types in a separate, future post.
After a strong uptrend, one particular candle can be a powerful warning sign that the tide is about to turn: the Topping Tail.
Let’s break down the psychology behind this specific candle, as seen with candles A, B, and C on the chart.
The Battle of the Topping Tail
The Buyers Were in Control: Buyers were in charge, pushing the price up from the open. This created a long tail on the top, showing their strength and confidence.
Then, the Sellers Rushed In: Right as the price peaked, big sellers—the "smart money"—came in. They aggressively sold shares to take profits, creating the long upper wick on the candle.
The Buyers Retreat: Buyers lost their fight against the sellers. The price was forced down from its high, ending the period with a small body near the bottom.
The Psychological Takeaway
The Topping Tail is a powerful shift in market psychology. It shows us:
Exhaustion: The market’s upward momentum is gone. The bulls gave it everything they had, but they failed to hold the high ground.
A Shift in Power: The balance has tipped. Sellers have now gained control, and fear is starting to replace the previous optimism.
Institutional Selling: The long tail suggests that major players are aggressively selling their positions, a strong signal that a downtrend is likely imminent.
Ultimately, the Topping Tail is a vivid snapshot of a failed attempt to go higher. When you see this candle after a prolonged uptrend, it’s a strong signal that the uptrend may be over and a reversal is on the horizon.
Note: 📊 Studies on candlestick reliability (like Thomas Bulkowski’s research) suggest that topping-tail-type candles have around55–60%probability of leading to at least a short-term pullback — but much less if taken in isolation without trend/volume context.
Final Thoughts
While candlesticks are a powerful tool, remember that no single signal is perfect. To get the odds in your favor, technical analysis should always rely on more than one indicator. Next, we’ll explore the magic of volume and how it adds a crucial layer of confirmation to our analysis.