Costco Is Down 20%. I’m Interested — Here’s Why
By Harsh Shah · Updated
Disclaimer: This information is for educational purposes only and should not be considered financial advice.
Costco dropped ~20% from its all-time high — sliding from $1065 to nearly $875.
For a stock of this quality, a correction this deep is extremely rare. And whenever something rare happens in the market… opportunity follows.
This move has now created a 3-factor confluence setup — one that works beautifully for a swing trade, and even better as a long-term entry.
I’ve taken a position at $875.87, and I’m attaching a snapshot of my brokerage P&L for full transparency.

Before we break down the setup, let’s take a moment to understand the pattern that’s driving it.
What Exactly Is a Wedge?
A wedge pattern forms when price movements get squeezed between two converging trend lines — one sloping down and the other sloping up.
It’s a sign that momentum is fading, and a breakout is near.
Think of it like a spring being wound tighter — the more it coils, the more powerful the release.
I categorize the wedges into three types
Falling Wedge — The Bullish Setup
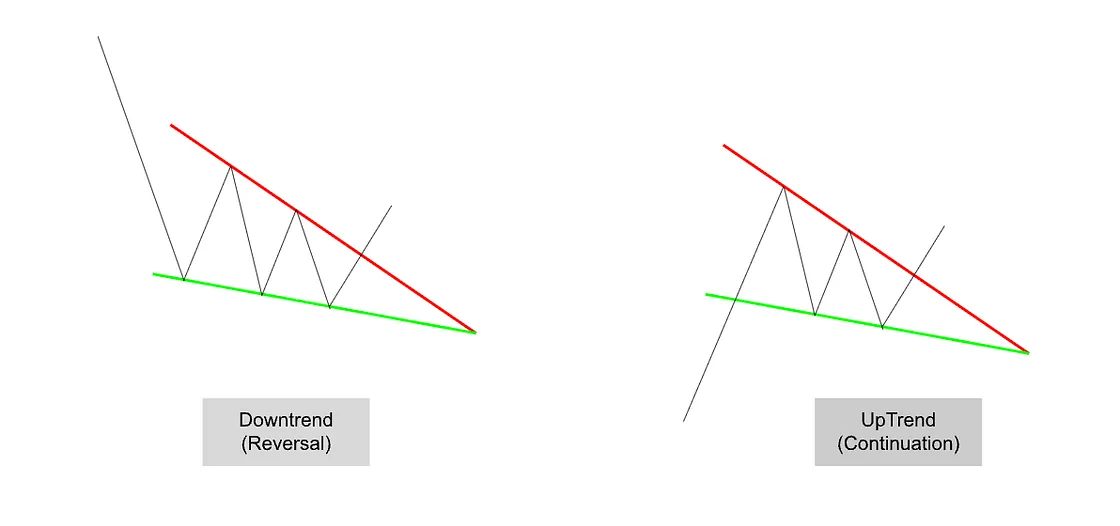
- Shape: Both trendlines slope downward.
- Meaning: Price is falling, but sellers are running out of steam.
Eventually, the price breaks above the upper resistance line — often triggering a sharp bullish reversal.
Note: The probability of an upward breakout is high because, even if the price initially breaks down from the pattern, the downfalling wedge’s intrinsic bullish nature suggests an eventual reversal and move to the upside.
Why a Falling Wedge Is Bullish
- Price keeps falling, but each drop gets shallower — sellers are losing momentum.
- Buyers quietly step in earlier on every dip, absorbing supply.
- The pattern compresses like a coiling spring, building pressure for a breakout.
- Breakouts usually occur upwards as the downtrend exhausts.
- A close above the resistance line confirms the bullish reversal.
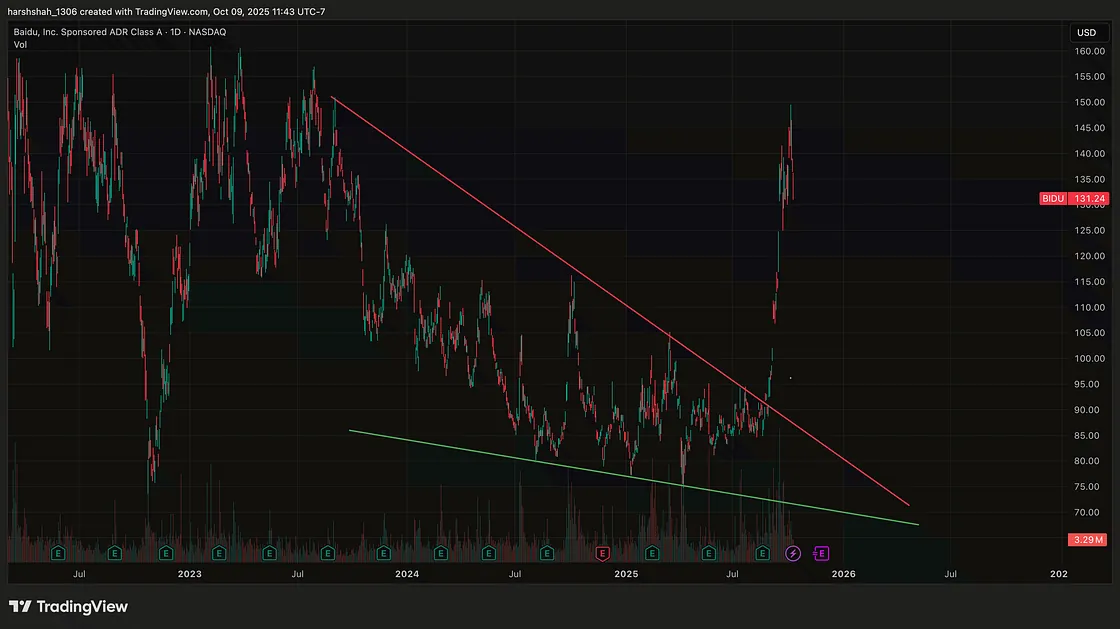
Case Study: Baidu’s Downsloping Wedge Breakout — A 60% Rally
Take Baidu.
After spending months inside a falling wedge through late 2023, the stock finally broke out in September — and ripped higher.
A clean breakout triggered a month-long rally from $92 → $150, delivering over 60% upside.
These patterns don’t appear often…
but when they do, the moves can be powerful.
Now let’s bring it back to Costco — and why this setup has my attention.
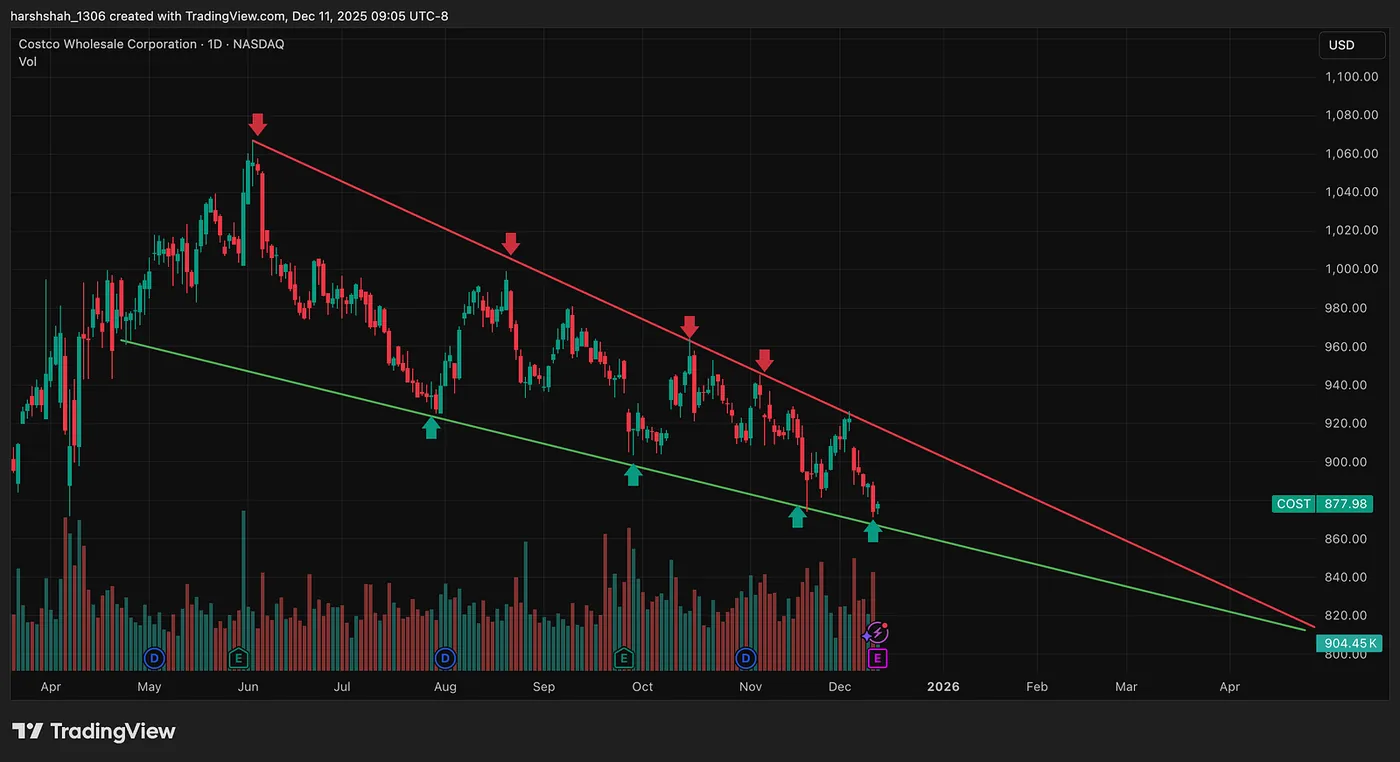
Costco: Factor 1 — Downsloping Wedge
Costco is moving inside a clean downsloping wedge, with price compressing deeper into the structure.
This reflects fading selling pressure — the first clue of a potential reversal.
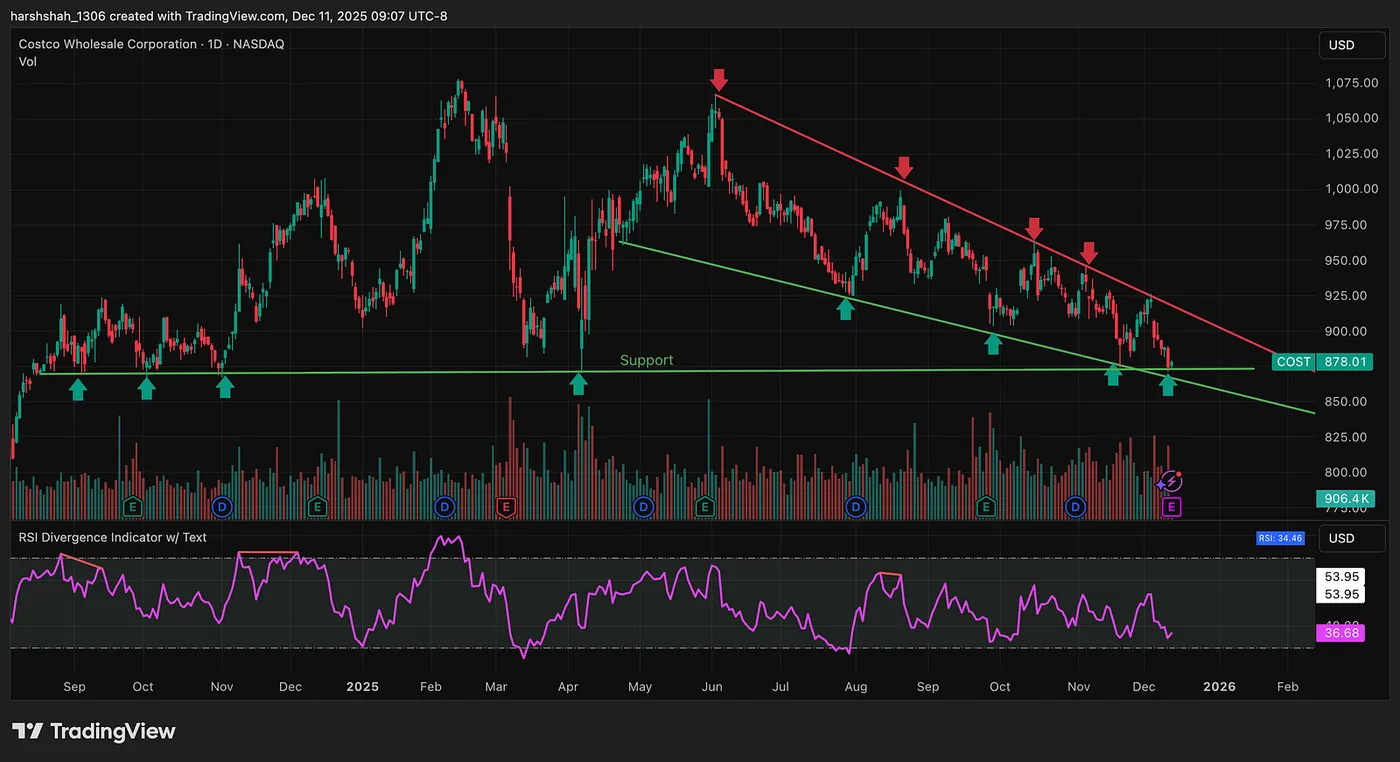
Costco: Factor 2/3 - Major Support Zone + Oversold RSI
Price is sitting right on a high-probability support zone, an area that has historically attracted strong buyers.
RSI is beaten down, signaling exhaustion among sellers and priming the stock for a possible bounce.
Support + Oversold Momentum = High-Risk-to-Reward Opportunity.
The Risk
As of 12/11/2025, Costco reports earnings after hours. This means the stock can jump, dump, or whipsaw in the near term.
Despite that, I like the structure enough to take the trade — but with a stop-loss. Any confirming close below the support zone would invalidate the setup for me.
The reward-to-risk at this level is attractive, and that’s why it’s on my radar.
Final Thoughts
Costco’s ~20% correction isn’t just another dip — it’s a rare alignment of price structure, support, and momentum, all unfolding inside a classic falling wedge.
These setups don’t guarantee success, but they do offer something every trader looks for: asymmetric opportunity — where the upside potential outweighs the downside risk.
If the wedge breaks out cleanly, Costco could begin a meaningful recovery.
If support fails, the trade is simple — cut it and move on.
But when a high-quality stock meets a high-probability pattern at a high-value zone…
that’s when I pay attention.