How to Identify Overextended Stocks and Start Booking Gains Before the Market Gives Them Back
By Harsh Shah · Updated
Disclaimer: This article is for educational purposes only and should not be considered financial advice.
Some blogs are planned. This isn’t one of them.
Whenever I’m losing money or making mistakes, my first instinct is to figure out how to stop that mistake from happening again. This blog is one of those moments.
Last week, as we all know, the market dipped. So did many of my holdings.
It always feels bad when you see signals popping up on your charts, but you don’t act on them. This was one of those times.
My biggest winner, Microsoft, went from 467 down to 411.
Of course, with hindsight, the answer is easy: sell at 467 and buy back at 411.
But that’s not how real trading works.
So I started asking myself:
Could I have done something differently?
Was there a common characteristic that appears before stocks become too extended?
I went back through the charts, analyzed previous runs, and to my surprise, I found something that might act as a safety net.
As most of you know, I rely heavily on the 8 EMA and 21 EMArelationship.
When a stock is healthy and bullish, the 8 EMA stays above the 21 EMA.
But when a stock becomes too bullish, something interesting starts happening. Price gets extremely stretched away from the 21 EMA.
That got me thinking:
Could this be used as an early warning sign to start booking profits?
Not because the trend is broken.
Not because the stock is bearish.
Simply because it has become too extended.
The Distance Correlation
The idea is simple.
Go back and study previous bull runs.
Measure how far price moved away from the 21 EMA before a meaningful pullback occurred.
Then compare those readings to what’s happening today.
If a stock repeatedly reverses after reaching a certain distance from the 21 EMA, maybe that’s a clue worth paying attention to.
Let me show you an example.
Micron
Every time Micron became significantly extended from the 21 EMA, a pullback followed.
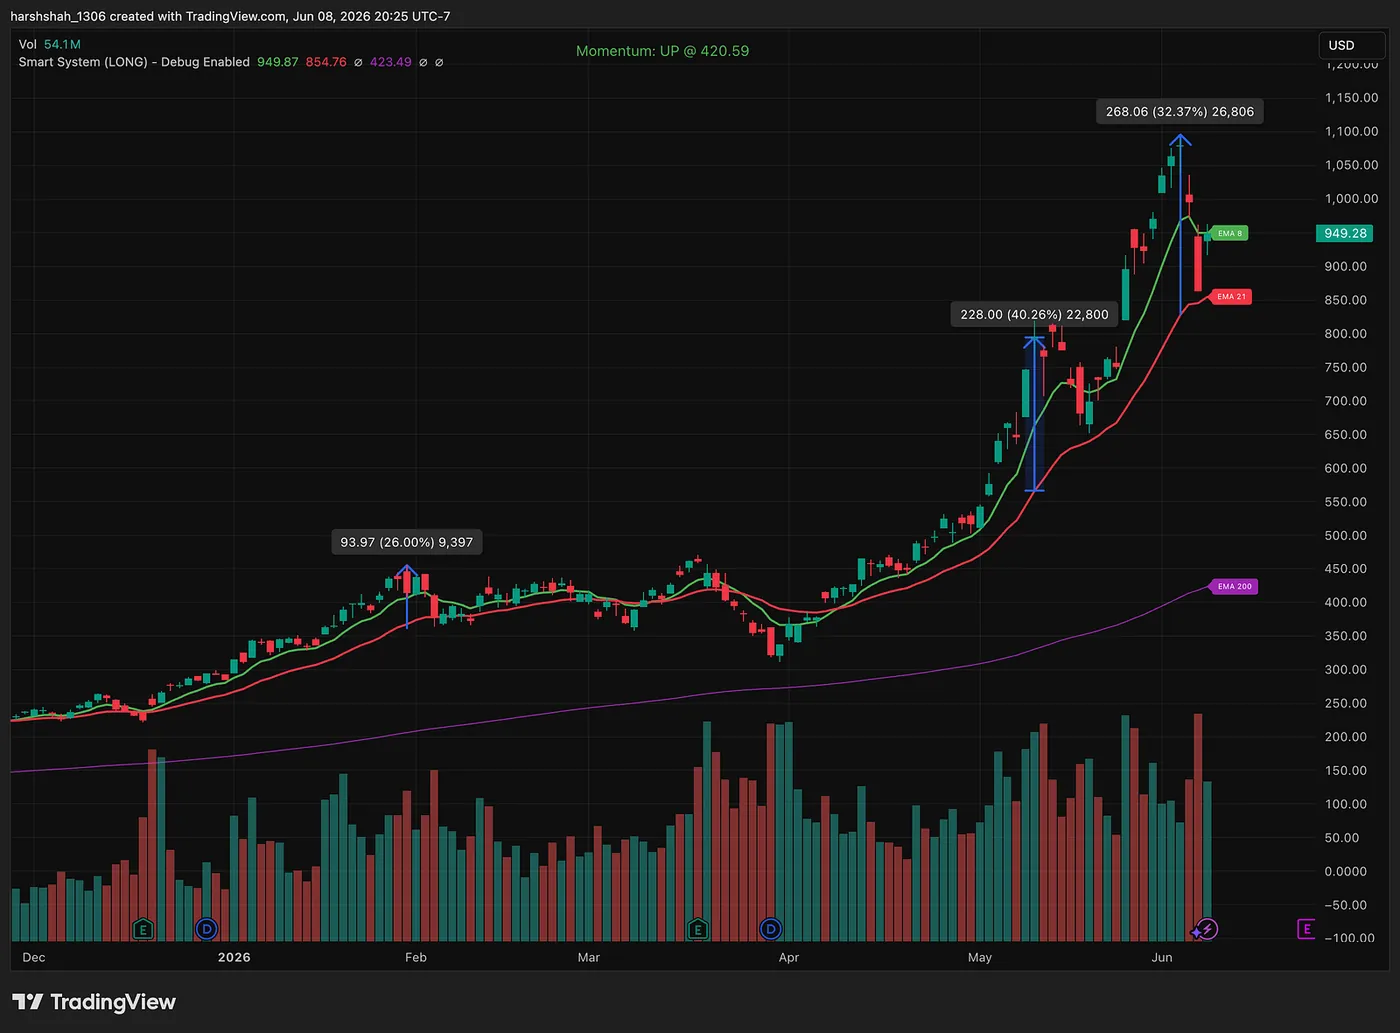
Case 1: 26% stretched above the 21 EMA
Case 2: 40% stretched above the 21 EMA
Case 3: 32% stretched above the 21 EMA
The exact percentage isn’t important.
What matters is the pattern.
For Micron, once price starts getting 25%+ above the 21 EMA, that’s my first cue to begin thinking about taking some profits.
Not necessarily selling everything.
Just reducing exposure and protecting gains.
Microsoft (MSFT)
I ran the same analysis.
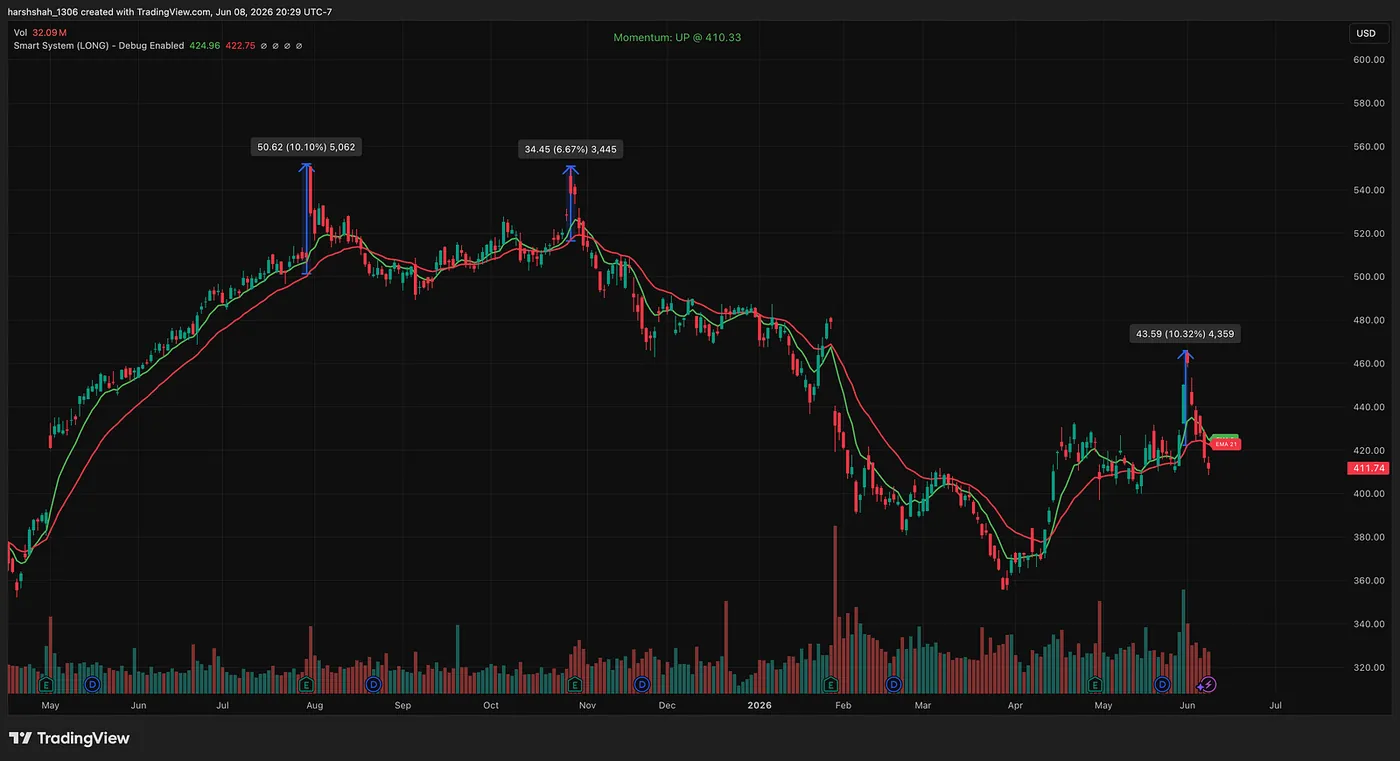
Case 1: 10.10%
Case 2: 6.67%
Case 3: 10.32%
Notice how different the numbers are.
Microsoft doesn’t need to become 25% extended before pulling back.
Historically, even a 7–10% extension above the 21 EMA has often been enough to trigger a cooling-off period.
That’s why looking at each stock individually matters.
Different stocks have different personalities.
What I’m Building Next
One challenge I have is that I simply don’t have the time to monitor every stock I own.
That’s where automation comes in.
I’ve started integrating this overextension analysis directly into my scanner. The scanner already runs across the entire U.S. stock market, looking for high-probability opportunities. Now, I’m teaching it to identify stocks that are becoming excessively stretched from their 21 EMA as well.
Whenever a stock enters its historical overextension zone, I’ll get notified automatically.
The goal isn’t to predict the exact top. It’s to identify situations where risk is increasing and the odds of a pullback are becoming elevated.
This allows me to stay ahead of the crowd and protect gains before the weakness becomes obvious to everyone else.
Again, this isn’t a signal I’d use in isolation. But when an overextension alert lines up with other factors such as topping tails, major resistance levels, weakening momentum, or broader market weakness, it becomes a powerful tool for managing risk and locking in profits.
Want a quick peek into my scanner ? Watch here
Please note: my scanner is in testing phase, and i am making it intuiotive, low noise etc.
Want a quick peek into my scanner? Watchhere.A quick note: the scanner is still in active testing and development. My focus right now is making it intuitive, actionable, and as low-noise as possible.
The goal isn’t to flood you with alerts. It’s to surface only the highest-quality opportunities and risk signals so you can spend less time scanning charts and more time making informed decisions.
Want early access ? Requesthere
Final Thoughts
One of the biggest lessons I’ve learned over the years is that making money and keeping money are two different skills.
Most traders spend their time looking for entries. Very few spend enough time thinking about exits.
This study started because I watched some of my strongest winners give back a meaningful portion of their gains. Instead of getting frustrated, I wanted to understand whether there were clues the market was giving me before those pullbacks happened.
What I found wasn’t a magical indicator or a perfect sell signal.
It was simply another layer of context.
Every stock has a point where it becomes stretched. By studying previous bull runs, we can identify those zones and use them to make more informed decisions when risk starts increasing.
That’s exactly why I’m integrating this into my scanner. If a stock is entering a historically overextended zone, I want to know about it before everyone else starts talking about the pullback.
Will it catch every top? Absolutely not.
But if it helps me protect profits, reduce drawdowns, and make slightly better decisions over hundreds of trades, that’s a meaningful edge.
And in the market, small edges compounded over time can make a very big difference.