Understanding the Relative Strength Index (RSI)
How I Beat FOMO and Spot Reversals Using One Simple Indicator
By Harsh Shah · Updated
Disclaimer: This information is for educational purposes only and should not be considered financial advice.
Ever see a stock soaring, only to FOMO’d into it just to see the trend reversing right after?
Did you ever wonder, “Why does this always happen to me? Is the market secretly watching what I’m doing?”
I’ve been there!
What if I told you there is a way to get ahead of a game with a simple strategy ?
It’s been a game-changer for my investing, and I hope it becomes a game-changer for you, too.
In this post, I’ll walk you through Relative Strength Index(RSI) w/
a) Real-world examples to help you spot a trend’s hidden weakness,
b) Explain the human psychology behind it
c) Share key rules for traders and long-term investors.
Stay with me to the end to truly stay ahead of the game!
Relative Strength Index (RSI)
The RSI is a momentum indicator that tells us whether a stock is running too hot (overbought) or too cold (oversold). It’s a number between 0 and 100.
- Above 70 → Stock may be overbought (prices ran up too quickly, could slow down or pull back).
- Below 30 → Stock may be oversold (prices fell too much, could rebound).
- Between 30–70 → Normal range, nothing extreme.
At first glance, it feels simple: buy when RSI is below 30 and sell when it’s above 70, right?
But it’s not the ideal way to use RSI.
Why?
Because in strong uptrends, RSI can stay above 70 for a long time. That “overbought” signal doesn’t necessarily mean the stock is about to fall — in fact, it can be a sign of strength. This is where the classic textbook approach breaks down.
The real edge lies in how smart traders use RSI differently. And that’s the hidden gem I’ll reveal next — with real-world examples.
How Smart Traders Spot Reversals
This is where RSI divergence becomes a critical tool for smart traders. It’s a signal that a reversal is brewing beneath the surface, even as the price trend appears to be continuing.
RSI divergence is a simple but powerful concept: it’s a disagreement between the price and the RSI.
- Bearish Divergence: The price makes a new higher high, but the RSI makes a lower high(learn more about trend here). This indicates the momentum behind the price action is weakening, suggesting a potential downtrend is on the horizon.
- Bullish Divergence: The price makes a new lower low, but the RSI makes a higher high. This shows that selling momentum is fading and buying pressure is building, hinting at a potential reversal to the upside.
By looking for this divergence, a trader can anticipate a shift in the market’s direction before it happens, using it as a signal to prepare for a potential reversal.
Lets understand this with some real world examples
Duolingo — A two factor setup: Bullish Divergence + Support Zone
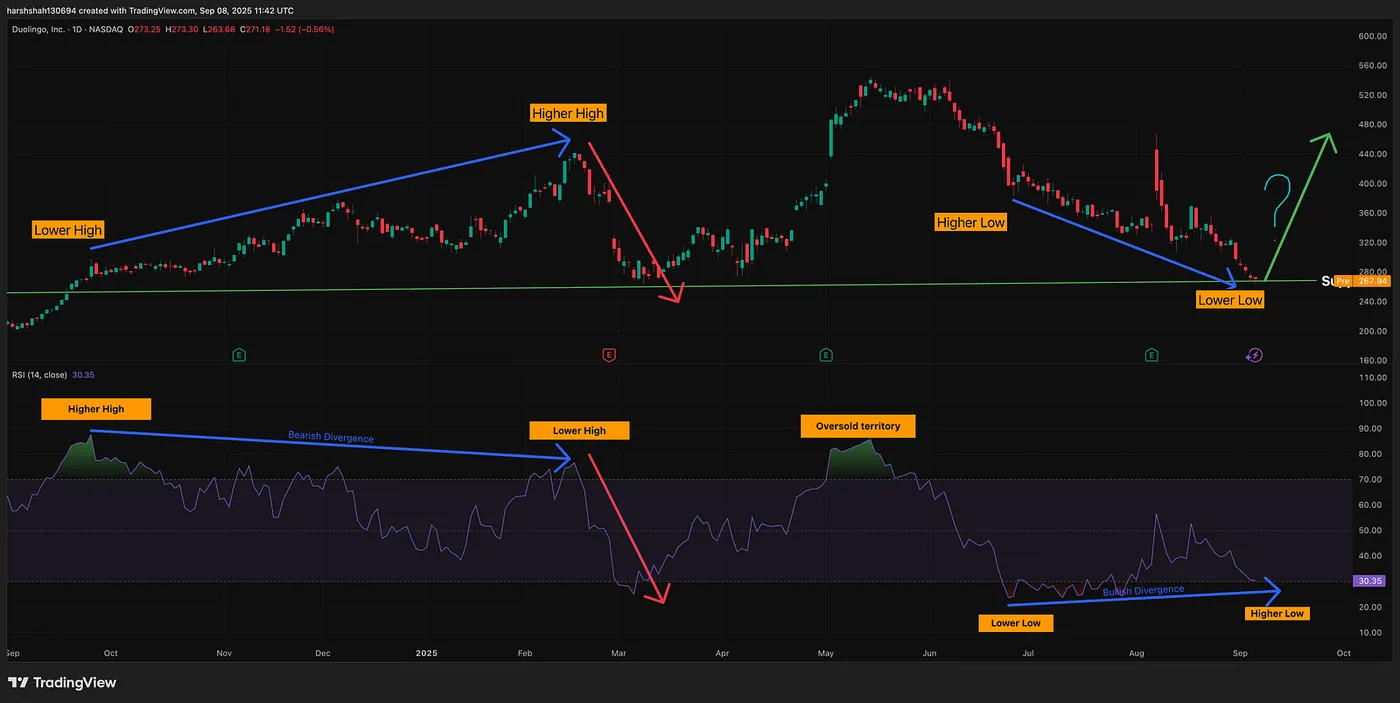
The Duolingo (DUOL) daily chart is a classic case study for both bearish and bullish divergence.
Bearish Divergence (Signaling a Top): Starting in late 2024 and culminating in March 2025, the stock formed a clear bearish divergence. The price made a higher high, reaching a new peak, while the RSI failed to confirm this move and created a lower high. This divergence signaled a loss of upward momentum, correctly identifying the top in DUOL’s price, which was followed by a sharp drop of over 40%
Bullish Divergence (Signaling a Potential Bottom): More recently, the chart formed a bullish divergence. The price made a lower low, while the RSI formed a higher low. This divergence indicates that the selling pressure is waning and buying interest is re-emerging, hinting that the stock may be establishing a bottom, especially as it’s occurring near a key support level.
A confluence of two key factors on the chart points to a high-probability reversal, increasing the odds to 60–70%.
GEV — Over bought RSI + Bearish Divergence
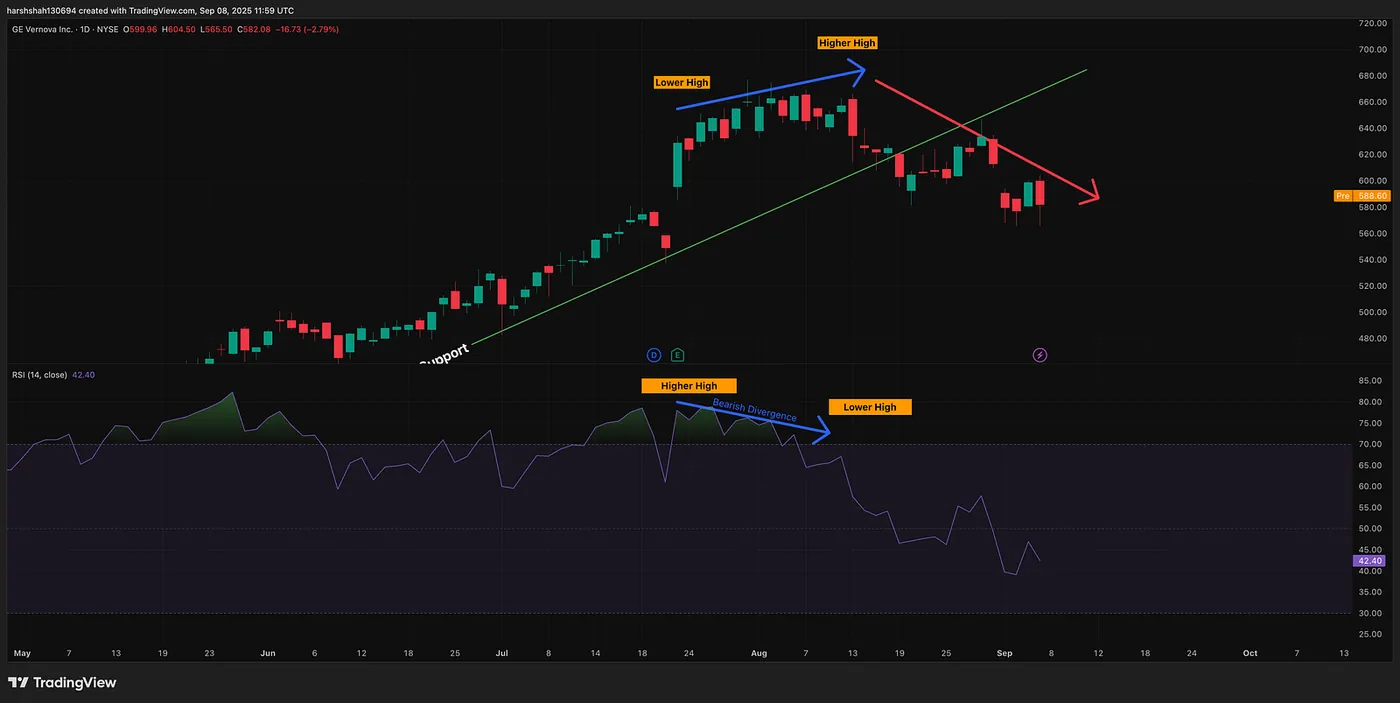
Bearish Divergence (Signaling a Top): The chart recently formed another bearish divergence. On August 13, the price made a higher high, but this was not confirmed by the RSI, which created a lower high. This signals a key shift in momentum and a potential reversal from the current trend.
Now that we’ve taken a look at multiple examples — lets try to understand the human psychology behind this!
The Psychology of a Bullish Divergence (Unloading by Institutions)
Imagine a stock has been in a powerful uptrend for months. The news is all positive, retail investors (the “crowd”) are excited, and the stock is making new all-time highs. This is the last leg of the rally, and it’s driven by a burst of enthusiasm from new, late-to-the-game buyers.
Here’s the logic from the institutional perspective:
- They are not chasing momentum: Institutional investors (pension funds, hedge funds, mutual funds) aren’t chasing momentum — they usually bought in early at lower prices and don’t need to add at the top.
- They are taking profits subtly: Unloading a massive position all at once would crash the stock and hurt their own profits. Instead, they start to “distribute” their shares quietly. They sell into the strength of the retail buying.
- A divergence forms: As institutions sell, momentum fades. The stock may still reach new highs, but RSI shows weaker strength because institutional selling offsets retail buying.
- The climax: The stock pushes to a final, slight new high — fueled by retail euphoria — but RSI doesn’t confirm. This signals that smart money has finished distributing, leaving insufficient buying power. The trend then reverses, and the price starts to drop.
In this scenario, the RSI divergence isn’t just a random signal; it’s a footprint of institutional selling. It shows that while the price is still going up, the underlying health of the trend is deteriorating because the biggest players are no longer participating on the buy-side.
The Psychology of a Bullish Divergence (Accumulation by Institutions)
Now, let’s look at the opposite scenario. A stock has been in a prolonged downtrend, and the news is all bad. Retail investors are panicking and selling, driving the price lower and lower.
Here’s the logic:
- Institutions don’t panic:They either sold earlier in the downtrend or now see a chance to scoop up quality stocks at a discount.
- They are accumulating quietly: Just like they can’t unload a large position at once, they can’t buy a large position at once without driving the price up against themselves. Instead, they start to “accumulate” shares subtly. They buy at key support levels and on dips, absorbing the selling from panicked retail investors.
- The divergence appears: The stock might dip to a new low, but institutional buying adds support. RSI doesn’t follow lower because selling pressure is weaker — large buyers are quietly absorbing supply.
- The trend reverses: Once institutions finish accumulating, selling pressure dries up and buying demand takes over. The price turns upward, starting a new uptrend. The bullish divergence was the early signal that the market was absorbing the last wave of selling before a major shift.
In essence, RSI divergence is a representation of the struggle between large-scale market participants (institutions) and the general public (retail traders). It’s a key tool that helps traders spot when the “smart money” is quietly moving in the opposite direction of the prevailing price trend, often foreshadowing a major reversal.
RSI for the Long-Term Investor
So, you’ve picked a great stock or ETF. Now, when should you actually buy it?
If you’re investing a lump sum, the key is to be patient. Avoid going all-in when the RSI is signaling the asset is overbought (above 70) or when a bearish divergence suggests momentum is fading.
For those who dollar-cost average (DCA), think of RSI as your guide. When markets feel stretched, it’s smart to scale back your contributions. On the other hand, a great time to be more aggressive with your buys is when:
- RSI is below 30 (indicating a potential bounce)
- RSI is in the normal range (between 30–70)
- A bullish divergence signals a reversal is brewing.
RSI For the Active Trader
For a more active trading strategy, RSI divergence is your key to anticipating reversals and timing your entries and exits.
Buy Signals (Going Long)
- Initial Signal: The RSI drops below 30, signaling an oversold condition.
- Primary Signal: A bullish divergence occurs — the price makes a lower low while the RSI makes a higher low. This indicates fading selling pressure and is a high-probability entry point.
Sell Signals (Going Short or Taking Profit)
- Initial Signal: The RSI rises above 70, signaling an overbought condition.
- Primary Signal: A bearish divergence occurs — the price makes a higher high while the RSI makes a lower high. This indicates weakening upward momentum and is an ideal time to take profits or consider a short position.
RSI Calculation (Simplified)
- Average Gains & Losses: First, we calculate the average gain and average loss over a specific period, typically 14 days.
- Relative Strength (RS): The average gain is then divided by the average loss to get the Relative Strength (RS).
- RSI Formula: This RS value is then plugged into the RSI formula to convert it into a value between 0 and 100.
RSI Formula: RSI=100−(100/(1+RS))
Example: Imagine a stock’s average gain over the last 14 days was 2% and the average loss was 1%.
RS: 2% ÷ 1% = 2
RSI: 100−(100/(1+2)) = 66
Adding RSI to TradingView
TradingView is a popular charting platform where you can easily add technical indicators like RSI.
Here are the steps to add the RSI indicator to your chart:
- Open your desired stock or crypto chart on TradingView.
- Click on the “Indicators” button at the top of the chart interface. It looks like an icon with a plus sign, or you can use the shortcut
/. - In the search bar, type “RSI” or “Relative Strength Index”.
- Click on “Relative Strength Index” from the results to add it to your chart.
- The RSI will appear in a new pane below the main price chart, allowing you to visualize its movement relative to the price.
Final Thoughts
The Relative Strength Index (RSI), when used to spot divergence, is a powerful tool. This divergence — where price and RSI move in opposite directions — is more than a simple signal; it’s a window into market psychology.
It reveals when “smart money” is quietly taking profits or accumulating shares against the current trend. By recognizing this divergence, you can spot the footprints of institutional activity, giving you a crucial edge to anticipate reversals and stay ahead of the crowd.