Understanding Market Trends
By Harsh Shah · Updated
Disclaimer: This information is for educational purposes only and should not be considered financial advice.
Nvidia has broken a key uptrend and confirmed a close below it. From a technical analysis perspective, this signals that the uptrend may have ended, suggesting buyer momentum has faded and a potential trend reversal could be underway.
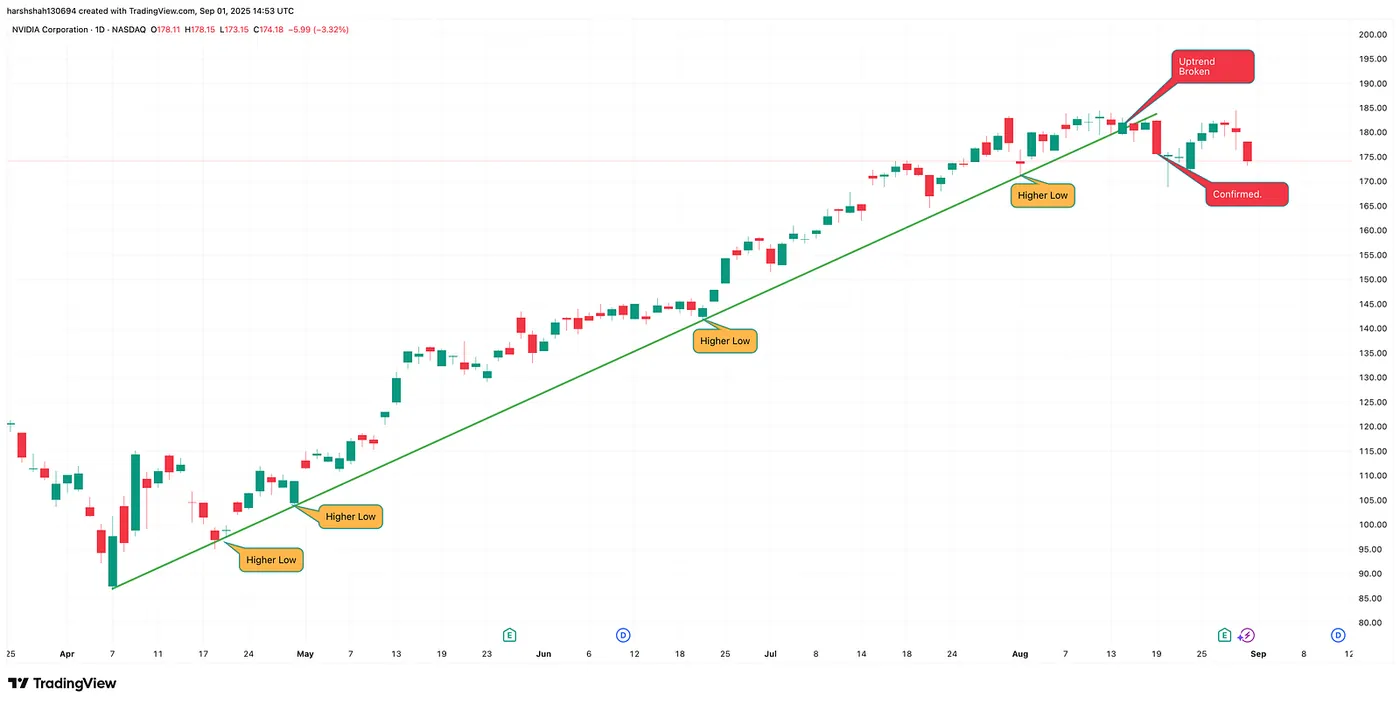
Before diving into more real world examples like Robinhood, ENPH, Baidu and other trends, let’s first understand what market trends are and how to master the skill of drawing and interpreting them like a pro.
You’ve probably heard people say, “the market always goes up.”
And while that’s true in the long run, the market doesn’t move in a straight line. It moves in waves — rising, pulling back, and then rising again.
👉 Here’s the key:
- When a chart shows higher highs and higher lows, it’s called an uptrend. This means buyers are in control, pushing the market higher step by step.
- When a chart shows lower highs and lower lows, it’s a downtrend. Sellers dominate, and prices continue to decline.
Recognizing these simple patterns helps you to understand the market’s direction with much more confidence.
Pivots
Pivots are just the points where price changes direction (local highs and lows). By connecting them, you can see if the market is trending up, trending down, or stuck in a range.
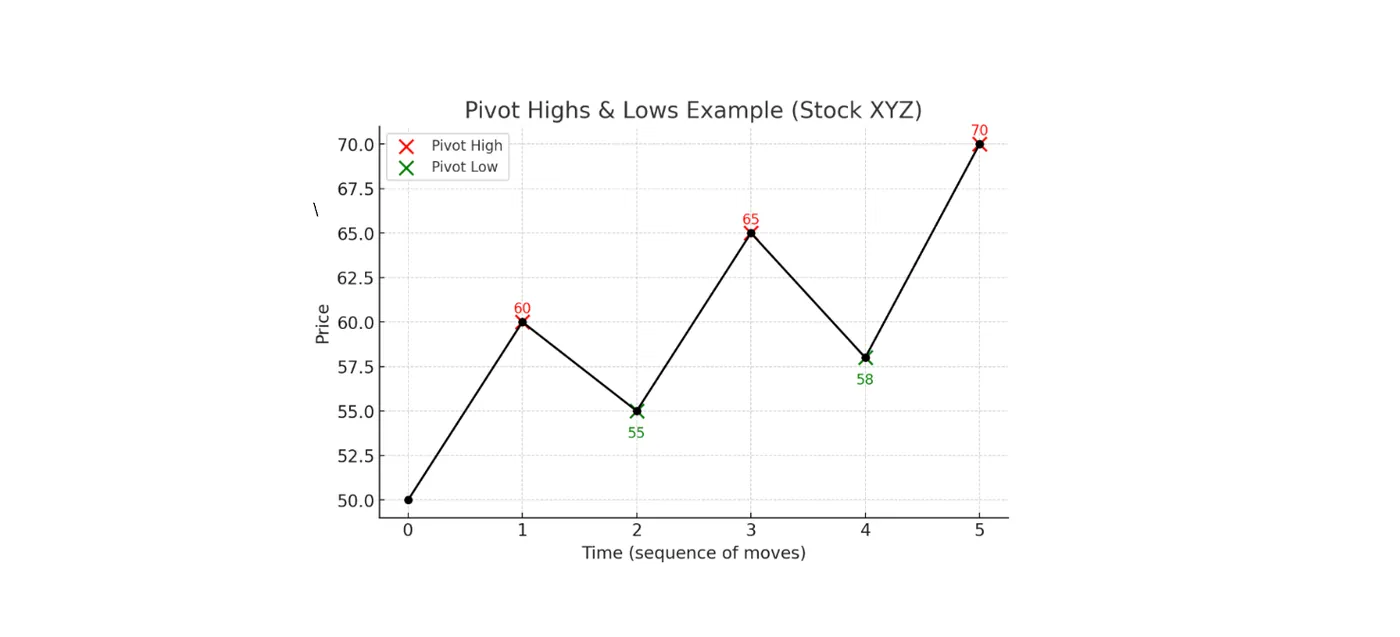
- Pivot Highs (red): $60, $65, $70 → points where price reversed downward.
- Pivot Lows (green): $55, $58 → points where price reversed upward.
UpTrend
Lets illustrate an uptrend with an example:
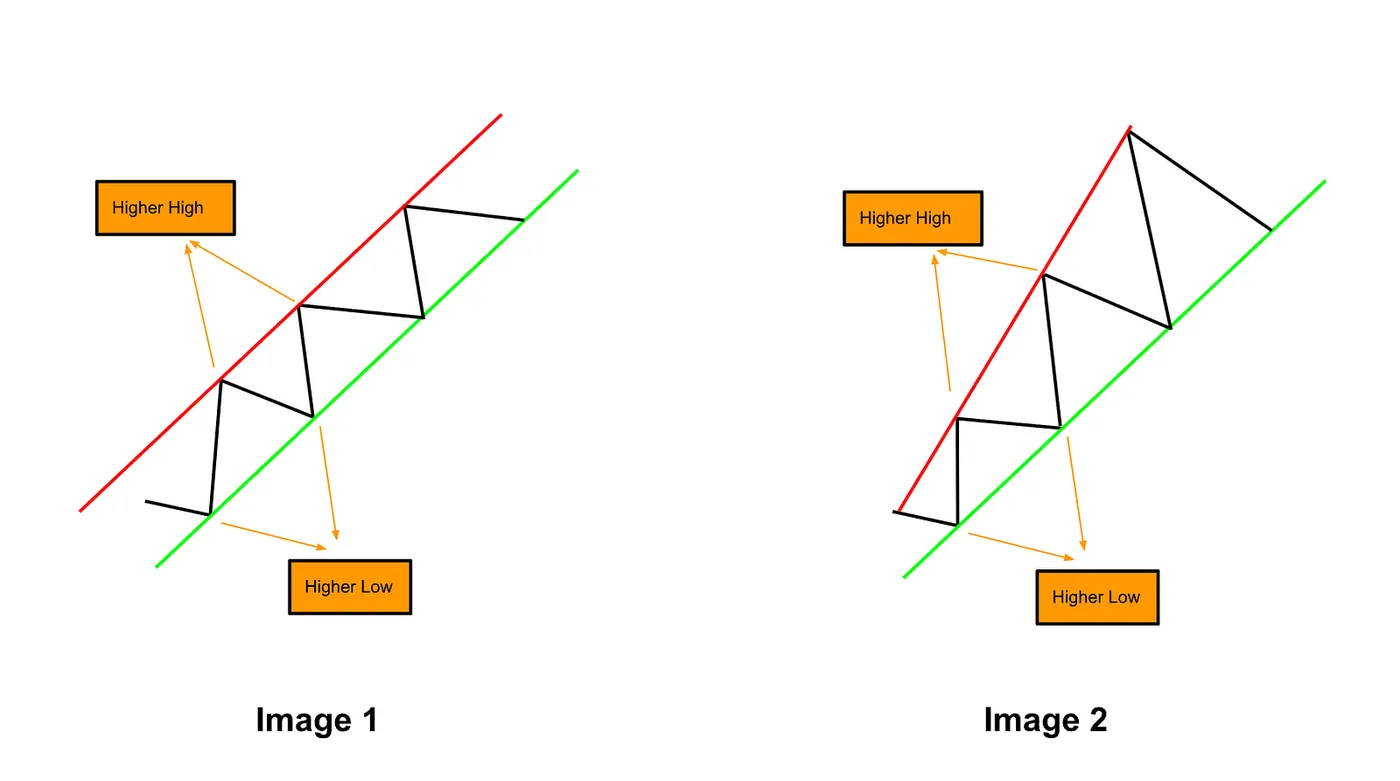
The line connecting the higher lows acts as support, while the line connecting the higher highs forms resistance. Support and resistance aren’t always fixed price levels — they can move dynamically as the market evolves.
Read more about Support and Resistance here.
But no trend lasts forever. Even within a strong uptrend, this trend eventually faces a higher probability of breaking down, reminding us that momentum always shifts over time.
In Image 1, the higher highs and higher lows are connected by two parallel lines, forming a parallel channel— signaling a steady uptrend within defined boundaries.
What Drives an Uptrend (and Those Pullbacks Along the Way)?
Markets mirror human psychology. An uptrend forms when optimism and buying pressure push prices higher, creating higher highs and lows. Pullbacks happen as traders take profits or fear the rally won’t last, causing short dips. Then FOMO reignites demand, pushing prices to new peaks.
👉 In short: optimism drives uptrends, pullbacks reflect fear and profit-taking, and the cycle repeats.
DownTrend
Let’s Illustrate a Downtrend with an Example:
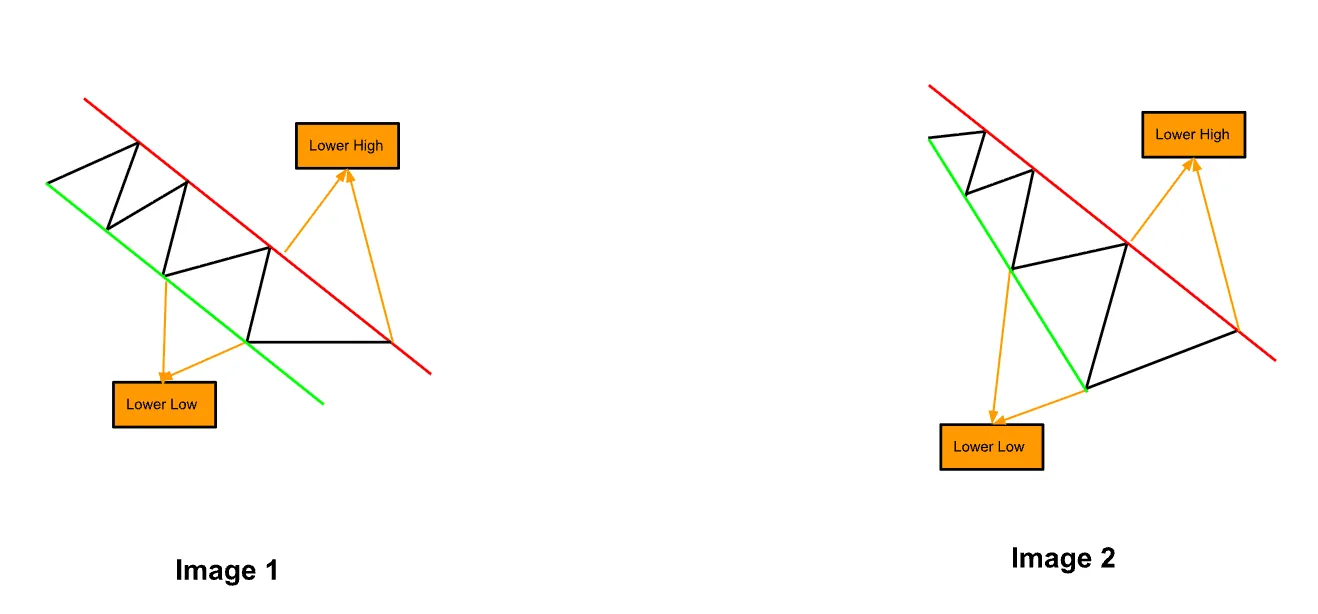
The line connecting the lower highs acts as resistance, while the line connecting the lower lows forms support.
Even in a strong downtrend, the trend will eventually face a higher probability of breaking above resistance, reminding us that momentum can accelerate and trends can extend or reverse over time.
What Drives a Downtrend (and Its Short-Lived Bounces)?
Markets fall when fear outweighs optimism. A downtrend forms as selling pressure creates lower highs and lower lows. Bounces happen when bargain hunters buy or short-sellers cover, causing brief rallies. But renewed fear and selling push prices lower again.
👉 In short: fear drives downtrends, bounces reflect hope and profit-taking, and the cycle repeats.
When Trend Reverses
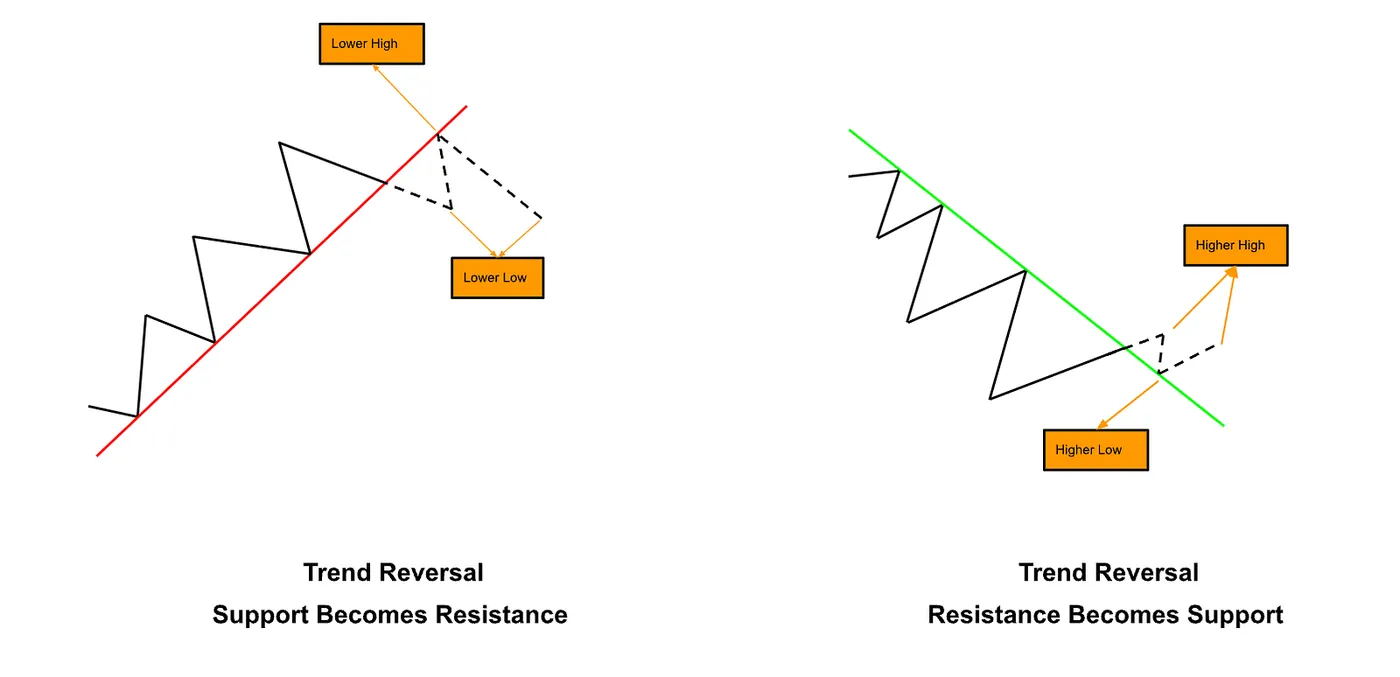
Trends don’t last forever. At some point, buying pressure can fade, or selling pressure can overwhelm, and the market shifts direction. This is a trend reversal — a critical moment where the old trend ends and a new one begins.
Once a reversal is confirmed (read more about confirmation signal here), what was support can become resistance, and resistance can become support. Understanding these turning points allows traders to anticipate potential moves rather than simply reacting to them.
👉 In short, trend reversals are nature’s way of reminding us that no trend lasts forever, and the market is always finding a new balance between greed, fear, and opportunity.
With each hit, the trend line weakens. By the 5th hit, there’s roughly a 50% chance of a break; by the 6th hit, the probability rises to around 60%, and so on.
Let’s examine some real-world example to see how trendlines can guide us in anticipating what comes next.
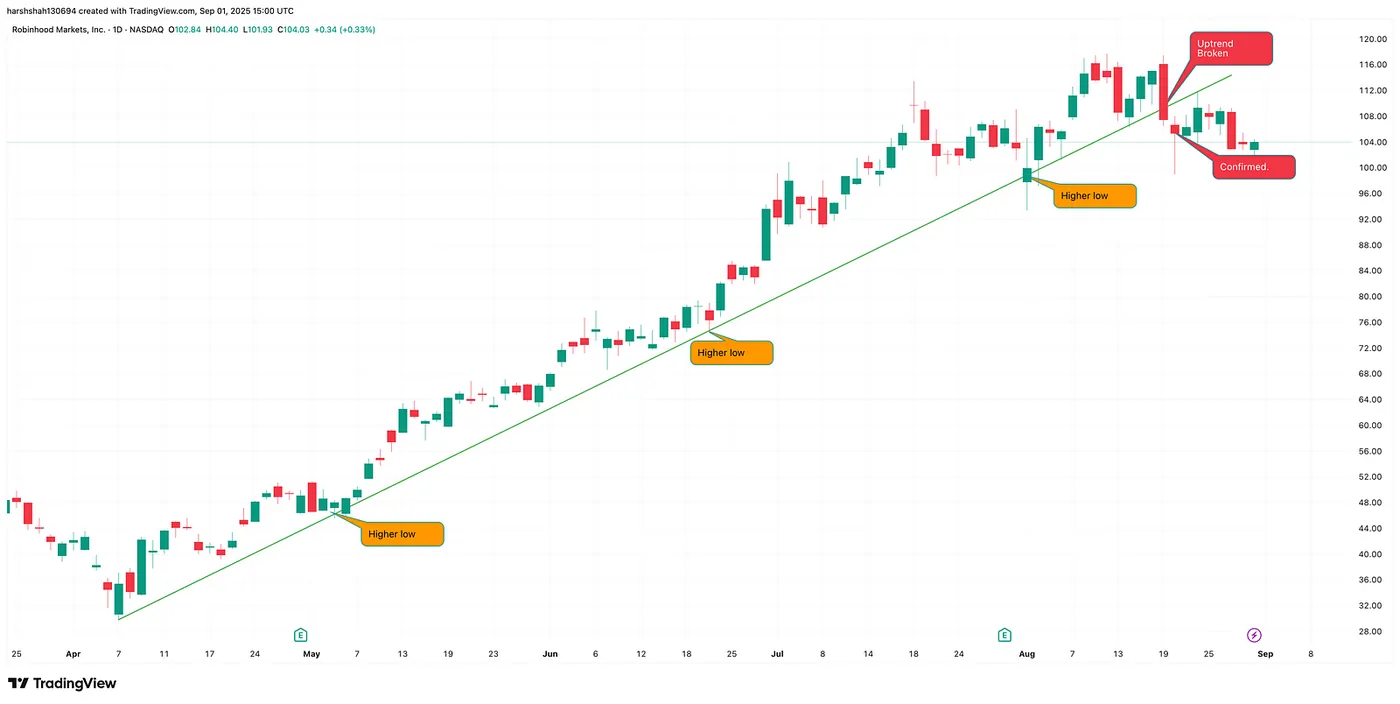
Robinhood — Daily Chart
Hood has broken a key uptrend and confirmed below it. Technical analysis suggests a potential reversal could be on the horizon in the coming days.
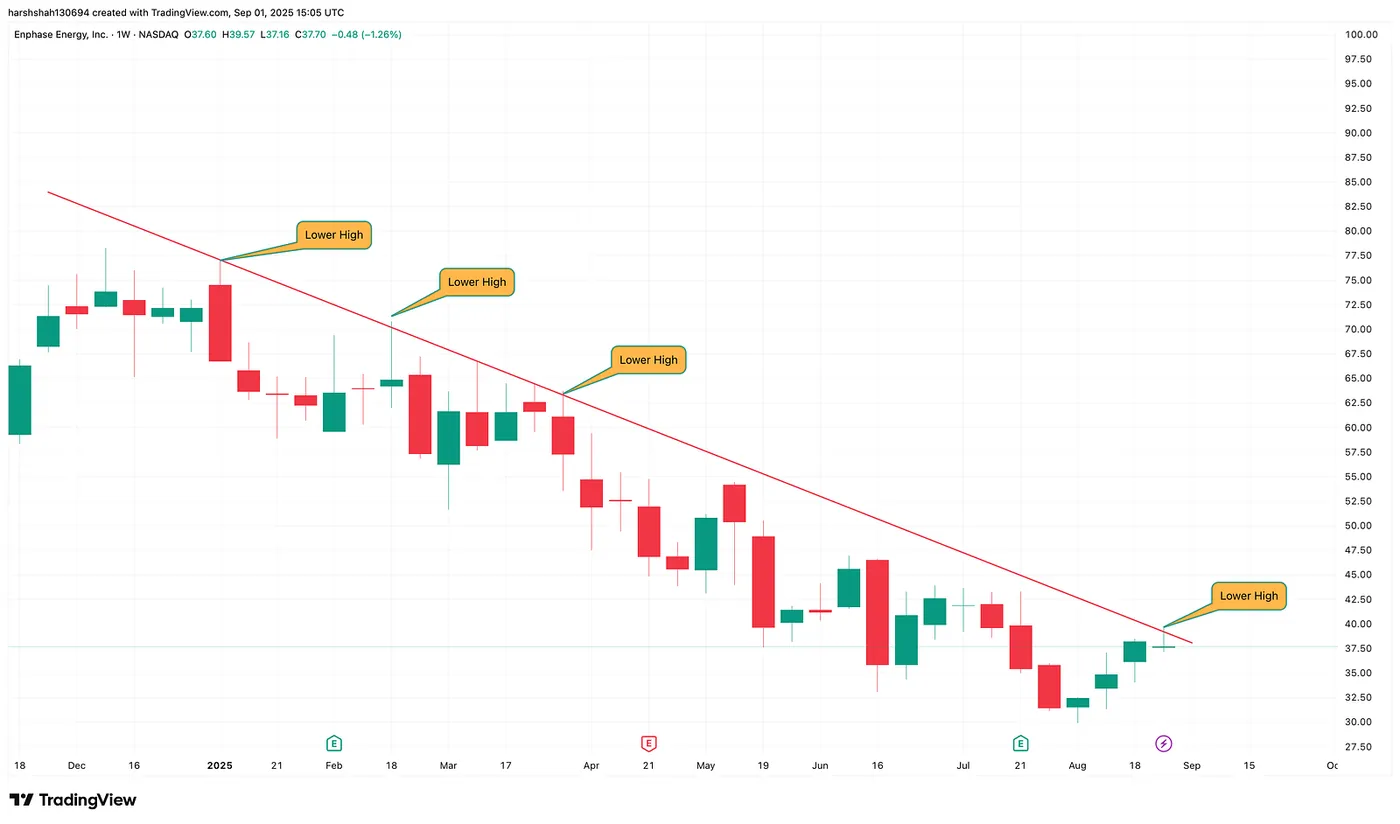
ENPH — Daily Chart
ENPH has been trending down lately, with each test of the resistance line showing signs of weakening. Could this signal a potential reversal? Let’s wait for a breakout and confirmation before jumping in!
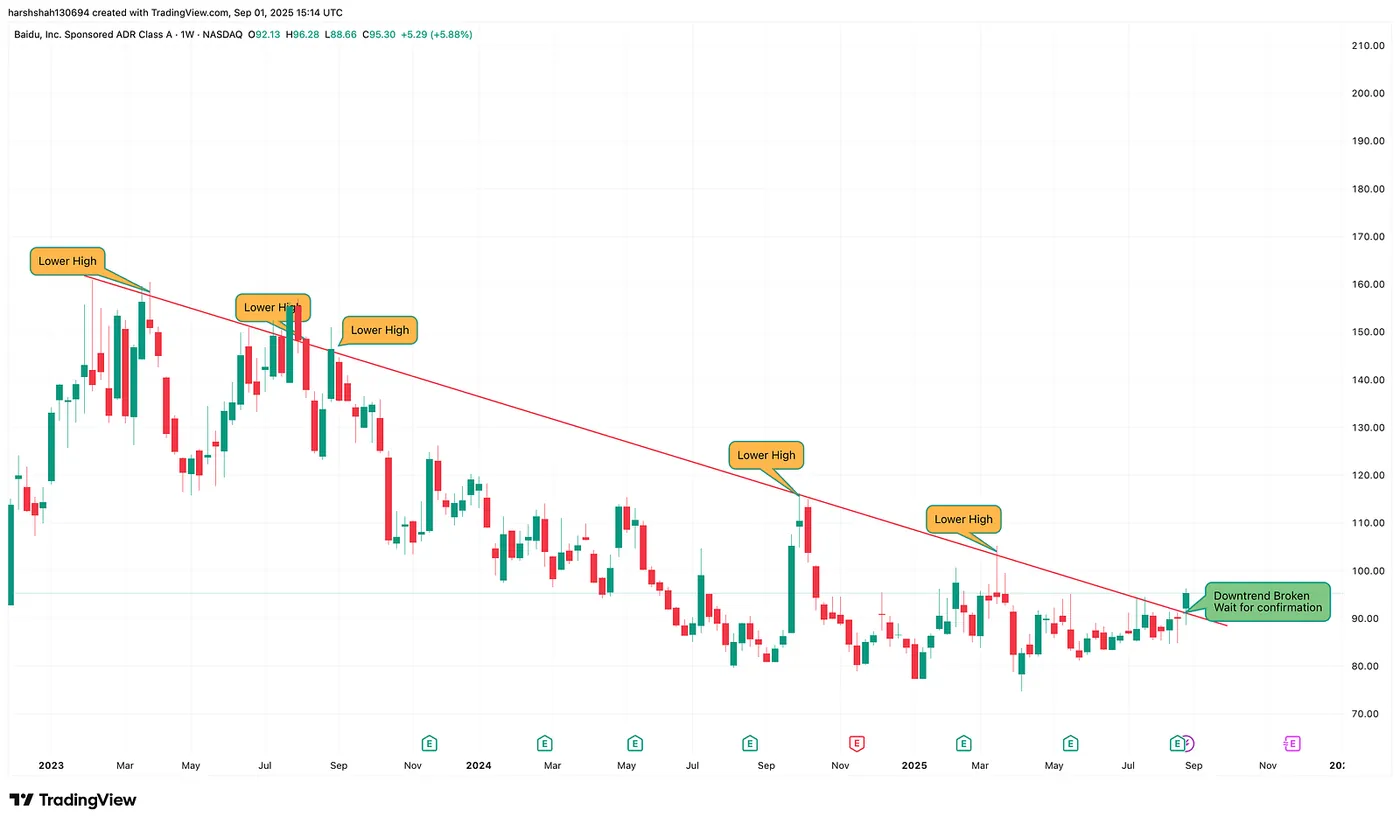
Baidu — Daily Chart
Baidu has broken through a key downtrend resistance, but confirmation is still pending. Let’s watch how it develops in the coming days.
Final Thoughts
Trendlines are more than just lines on a chart — they’re your roadmap in the market. By highlighting short-term trends and key support/resistance levels, they help you spot opportunities while avoiding FOMO buying or chasing dips during potential reversals. Mastering Trendlines means trading with clarity, confidence, and a sharper sense of timing.