Understanding the Confirmation Signal
How I Saved Thousands by Dodging MSFT’s Earnings Fakeout
By Harsh Shah · Updated
Disclaimer: This information is for educational purposes only and should not be considered financial advice.
MSFT pulled a classic fakeout that saved me thousands! 🚀 Right after earnings, it spiked to nearly $565, briefly breaking above resistance — but without confirmation.
The outcome? A sharp 10% pullback followed.
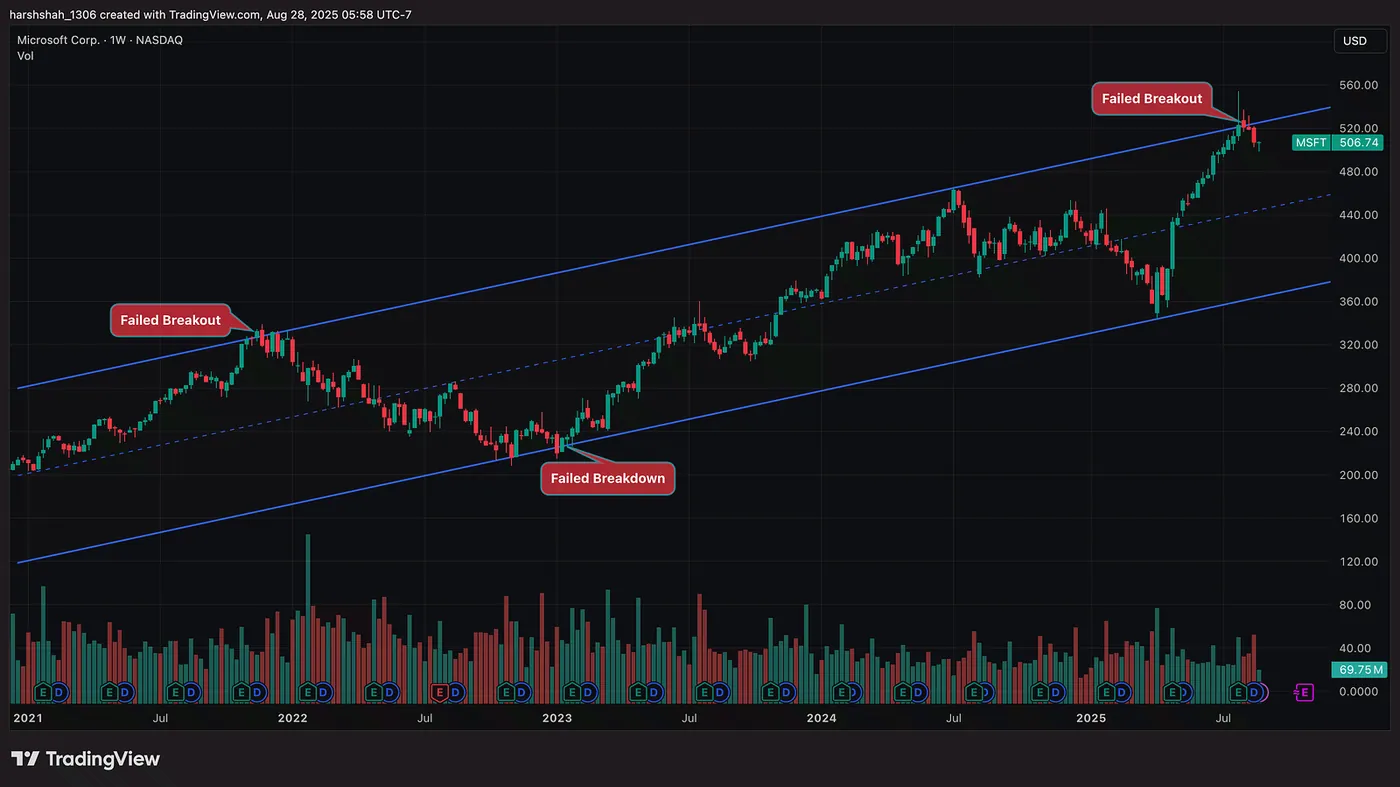
Before we jump into more real-world examples like Intel and Cava, let’s first break down the essential tools you’ll need to spot fakeouts and avoid getting trapped!
In the last chapter, we covered support and resistance — key levels where the market tends to make its biggest moves. When price nears these levels, it usually plays out in one of two ways:
- Breakout: The price convincingly moves past the level and continues in that direction.
- Fakeout: The price appears to break through but quickly reverses, trapping traders who jumped in too early.
The fakeout is every trader’s nightmare. Institutions and big players sometimes push prices above key levels, only to offload positions and drag the market back down. If you’re not careful, you could end up on the wrong side of that trap.
So, how do we avoid getting stuck in a fakeout?
Among the many strategies out there, one of my most reliable in my view is waiting for confirmation. What Does Confirmation Look Like?
- Upside breakout → Check if any candle that comes after the breakout closes above the high of the breakout candle.
- Downside breakdown → Check if the candle that comes after the breakout closes below the low of the breakdown candle.
If yes, that’s confirmation. If not, it’s a red flag.
| New to candlesticks? Readthisfirst before moving on.
Why Confirmation Matters After a Breakout
When a breakout candle forms, it often feels like the market is charging into new territory. But here’s the catch — not every breakout is real. Many times, that initial surge is nothing more than a trap, engineered by volatility, stop-hunts, or large players faking momentum.
That’s why you should never rely on the breakout candle alone. The confirmation candle is where the truth lies.
Why Is Confirmation So Important?
- Separates noise from strength
The first breakout candle might just be a spike. But when any of the next candle confirms in the same direction, it shows that buyers or sellers are truly backing the move. - Protects you from fakeouts
Without confirmation, price often snaps back — the classic fakeout where traders jump in too early, only to get trapped as the market reverses. - Psychology of commitment
Think of it like this: the breakout candle is the promise, but the confirmation candle is the delivery. Without delivery, the promise means nothing.
Next, we’ll walk through key examples and strategies for identifying true breakouts and avoiding traps.
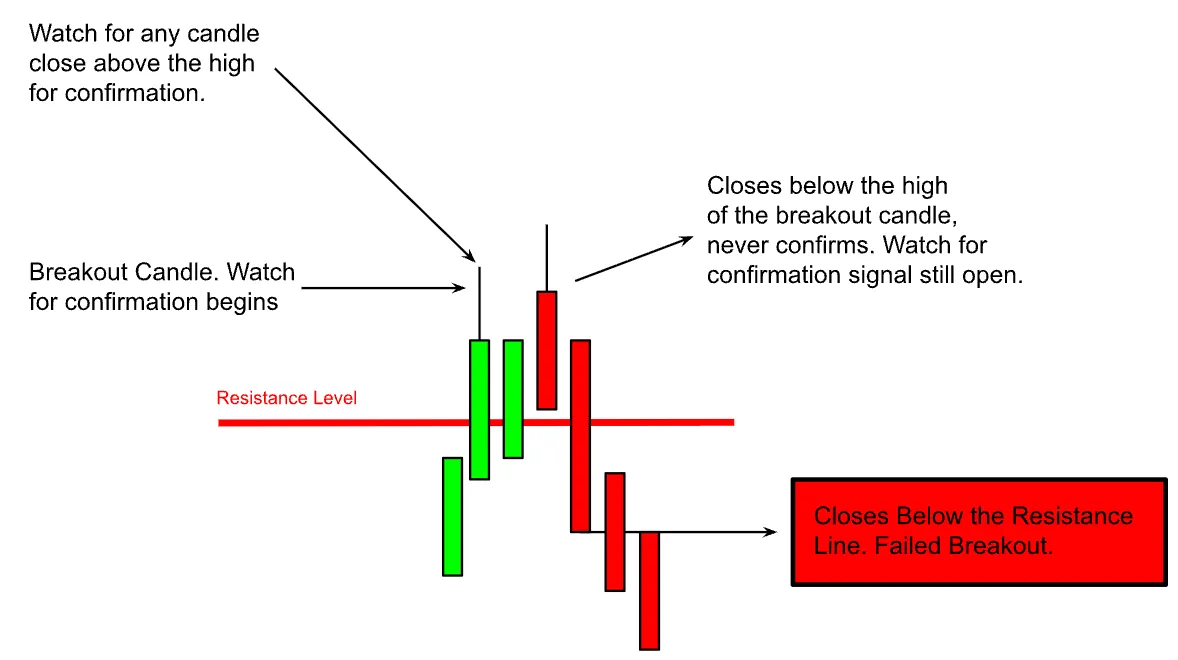
Case 1: Resistance Breakout, Failed attempt
- Breakout candle forms above resistance.
- No candle closes above breakout high → no confirmation.
- Price falls back below resistance → failed breakout.
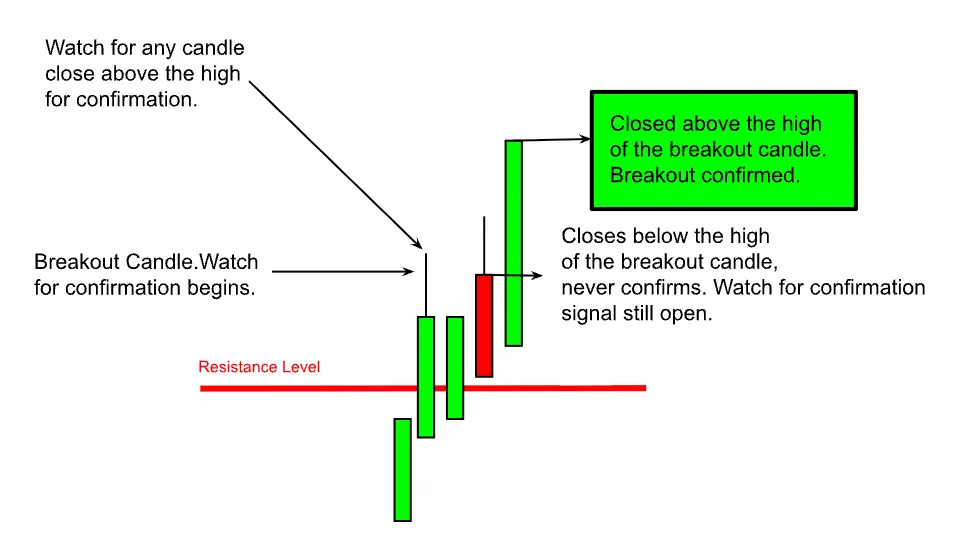
Case 2: Resistance Breakout, Confirmed Move
- Breakout candle forms above resistance.
- Watch for confirmation → candle closes above breakout high.
- Breakout confirmed → price gains momentum.
- Resistance now becomes support.
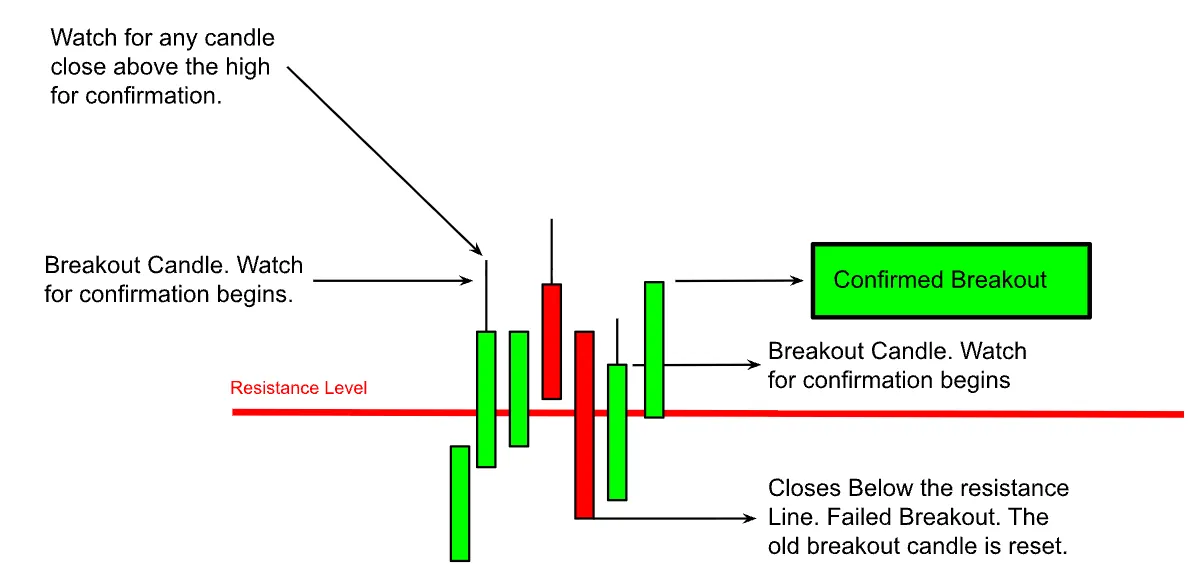
Case 3: Resistance Breakout, Second Attempt Confirmed
- First breakout candle forms, but price falls back below resistance → failed breakout.
- A new breakout candle appears → confirmation watch resets.
- This time, a candle closes above breakout high → second breakout confirmed.
- Resistance now becomes support.
Case 4: Support Breakdown, Failed Attempt
- Breakdown candle forms below support.
- No candle closes below breakdown low → no confirmation.
- Price moves back above support → failed breakdown.
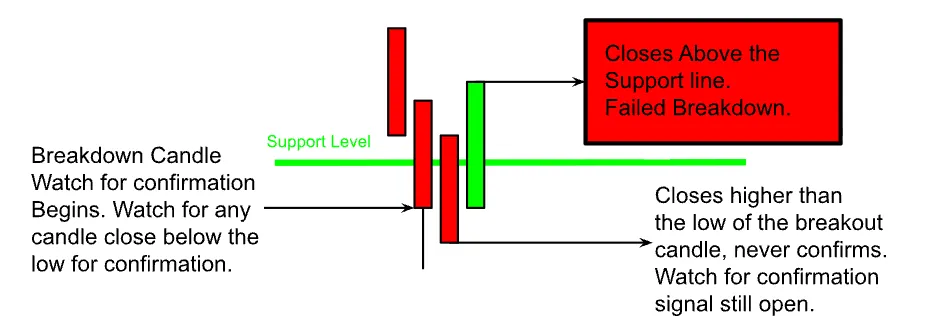
Case 5: Support Breakdown, Confirmed Move
- Breakdown candle forms below support.
- Watch for confirmation → candle closes below breakdown low.
- Breakdown confirmed → downtrend strengthens.
- Support now becomes resistance.
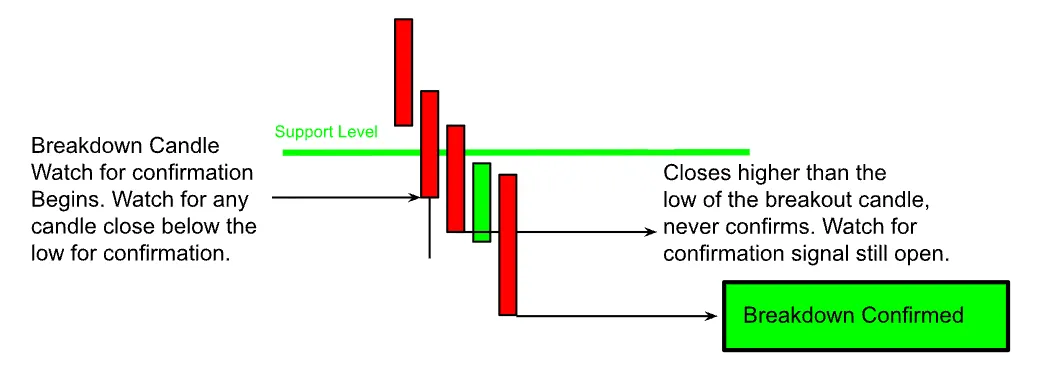
Case 6: Support Breakdown, Second Attempt Confirmed
- First breakdown candle forms, but price moves back above support → failed breakdown.
- A new breakdown candle appears → confirmation watch resets.
- This time, a candle closes below breakdown low → breakout confirmed.
- Support now becomes Resistance.
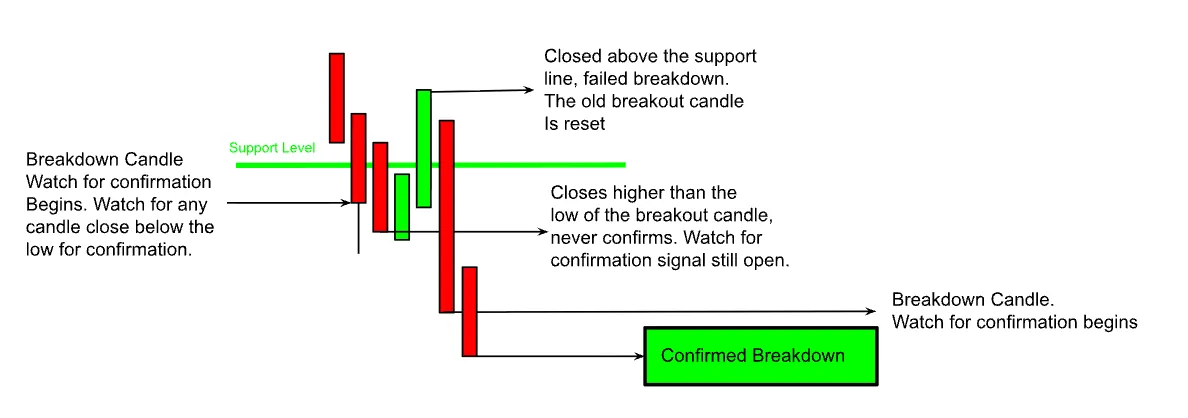
Let’s look at some real-world examples of fakeouts and reversals.
Intel (INTC) — Failed Breakdowns & Breakouts
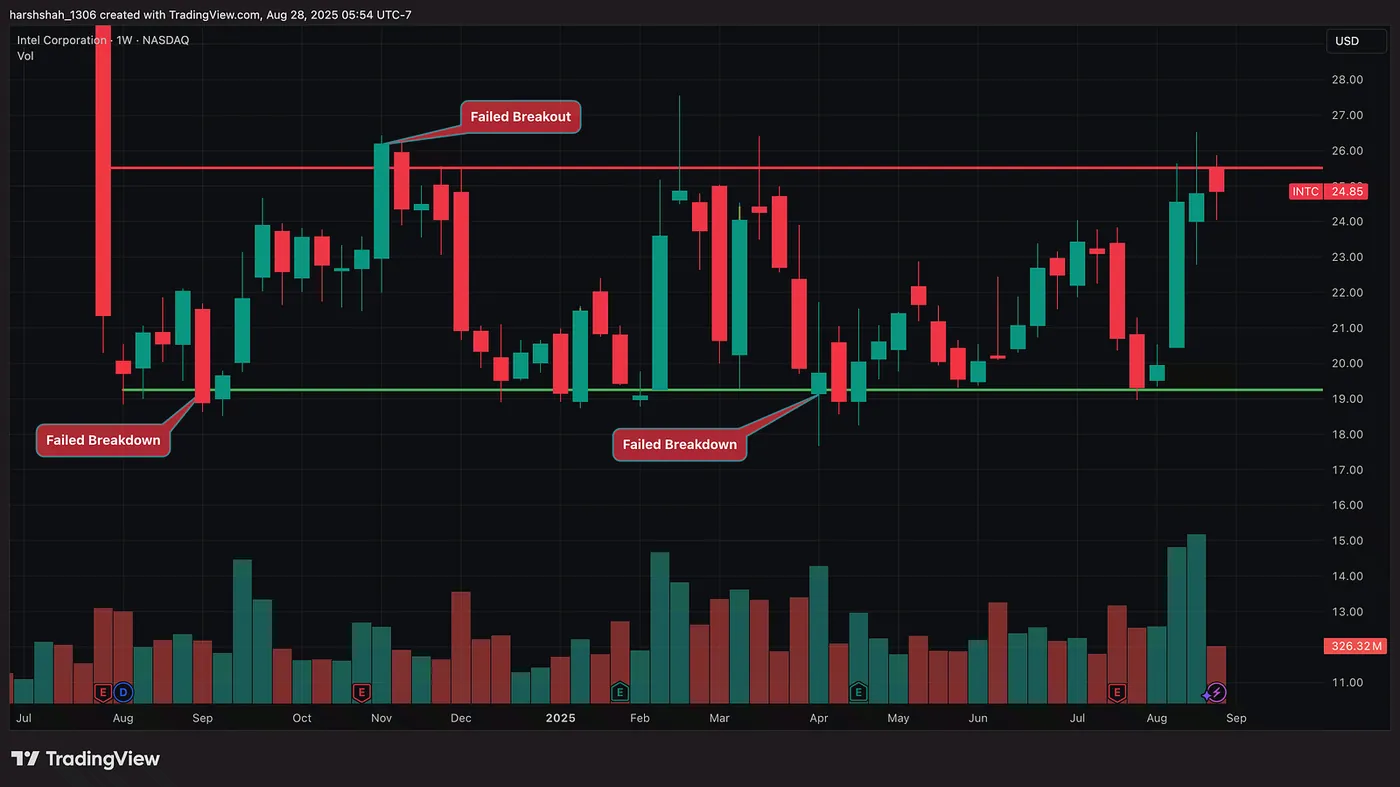
As shown in the chart above, Intel attempted to break a key support level several times but never received confirmation, resulting in a strong reversal. Similarly, it failed to confirm a breakout at resistance. By waiting for a confirmation signal, you can avoid getting caught in these traps!
Cava
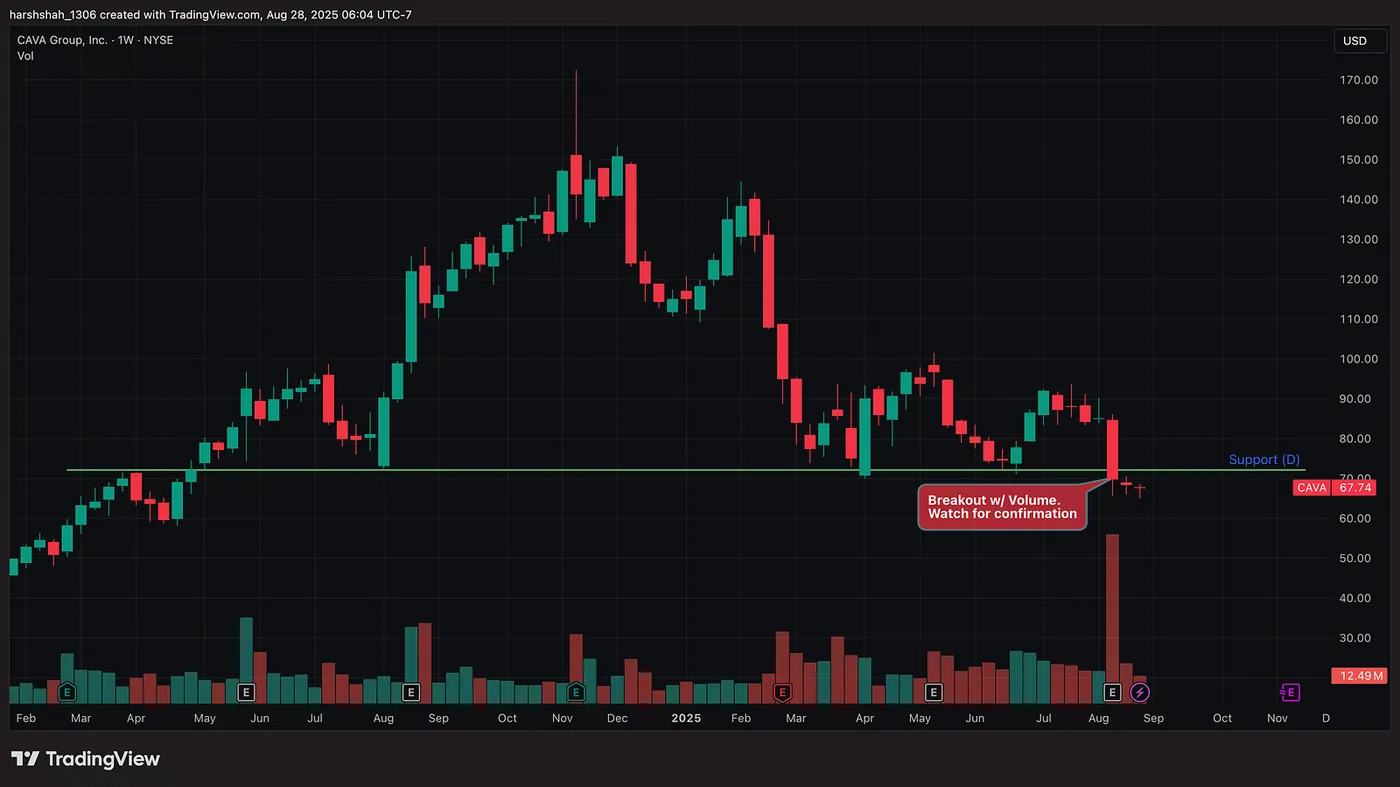
Cava has pierced a key support level, but has it truly confirmed? We’ll find out in the coming days!
Breakout Signals Across Timeframes: What Really Matters
This principle holds across all time frames — minute, hour, day, week, or month — but its reliability strengthens as the time frame expands. For example, a breakout on the weekly chart carries more weight than one on the daily. So, if you see confirmation on the daily but not on the weekly, it’s best to approach with caution.
Final Thoughts
Trading around support and resistance levels becomes far more reliable when paired with confirmation signals. A breakout (or breakdown) backed by volume and confirmation marks a clear shift in market character — turning support into resistance, or resistance into support.
Your Business — On AutoPilot with DDImedia AI Assistant
(Join Our Waitlist)
Visit us at DataDrivenInvestor.com
Join our creator ecosystem here.
DDI Official Telegram Channel: https://t.me/+tafUp6ecEys4YjQ1