Trendline Resistance setup · Updated Oct 24, 2026
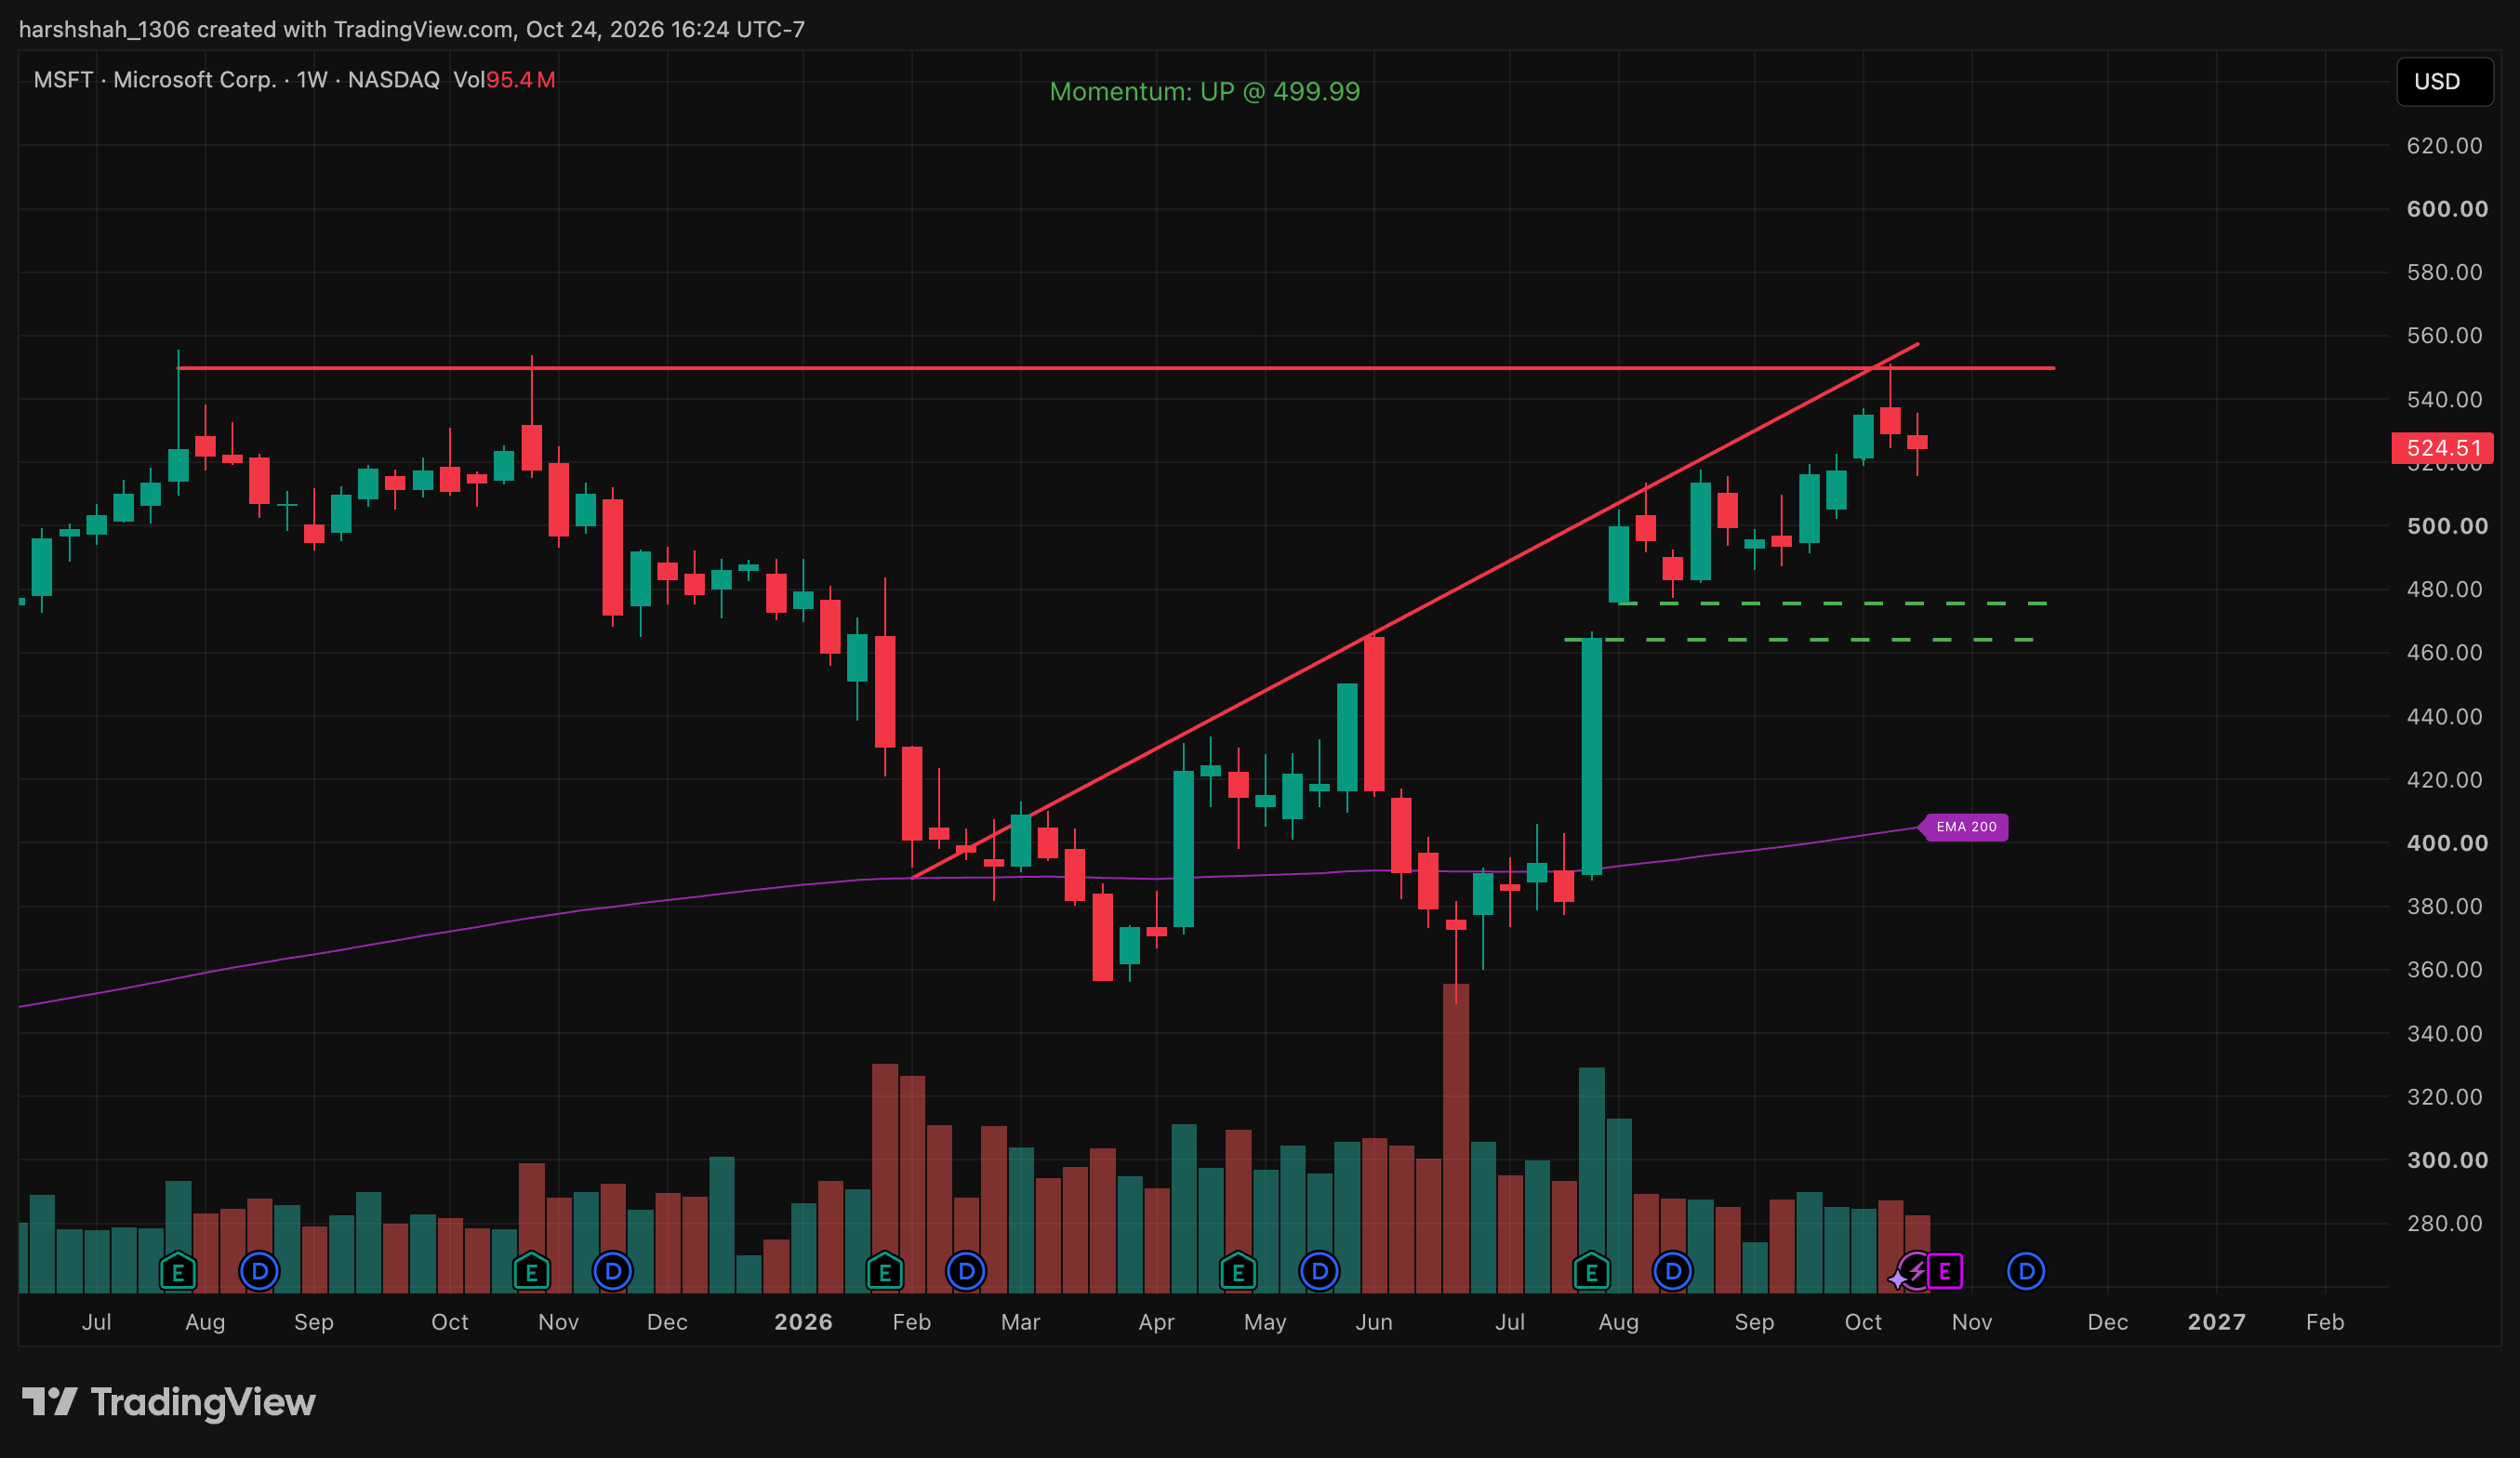
MSFT is trading into trendline resistance at 550. Support is positioned at 460-470.
Data Driven Investing doesn't give buy or sell recommendations. As of the latest chart (Oct 24, 2026), MSFT is in a Trendline Resistance setup with support at $460-470 and resistance at $550. Use these levels to plan your own entries, exits and risk, and remember the chart can change at any time.