Understanding Volume
Volume - The Power Behind the Price
By Harsh Shah · Updated
Disclaimer: This information is for educational purposes only and should not be considered financial advice.
Imagine a building’s foundation as a support level for a stock’s price. The amount of force hitting that foundation is the volume.
- When the price drops toward the foundation on low volume, it’s like a single person standing on it. The foundation is easily strong enough to hold them up. This suggests that the selling pressure is weak, and the price will likely “bounce” off thesupport level and go back up.
- If the price hits the foundation on high volume, it’s like a wrecking crew arriving with heavy equipment. The high volume of selling means a strong, organized force is testing that level. If the price breaks through thesupport levelon high volume, it signals that the “foundation” has been destroyed, and the price is likely to continue its fall. This is called a breakdown.
The same idea works in reverse for a resistance level, which is like a ceiling. A high-volume breakthrough of the ceiling is a powerful sign that the price is heading for new highs.
Understanding Red and Green Volume Bars
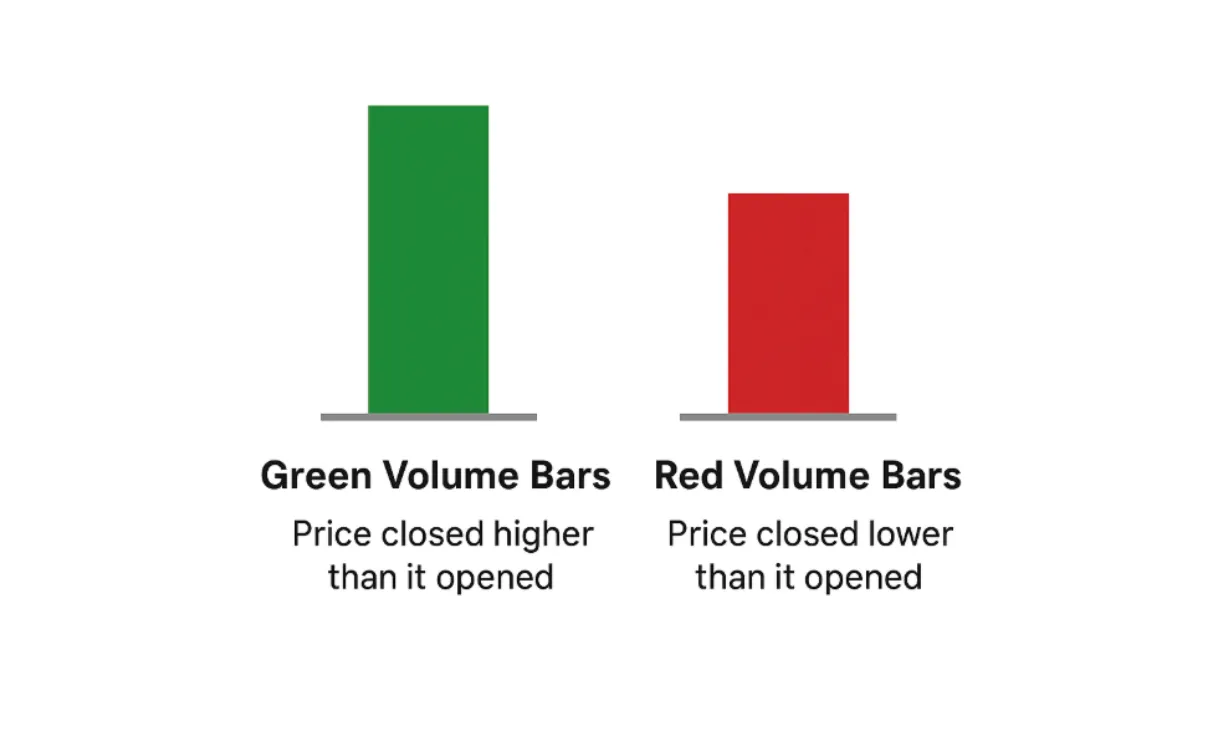
- Green Volume Bars: A Green volume bar means that the price of the stock closed higher than it opened for that specific time period (e.g., the day, the hour, etc.). It signifies that buyers were in control and pushed the price up. It’s often referred to as “bullish volume.”
- Red Volume Bars: A red volume bar indicates that the price closed lower than it opened for that period. This tells you that sellers were more aggressive, pushing the price down. It’s often referred to as “bearish volume.”
The Caveat It is crucial to remember that volume itself represents the total number of shares traded, not the number of shares bought vs. sold. Every transaction has both a buyer and a seller. The color simply provides a visual shorthand for the outcome of the battle between buyers and sellers within that time frame. The color tells you which side won, not how many trades were on either side. A large red volume bar, for example, could indicate a day with immense selling pressure, but it could also mean a huge number of buyers stepped in to meet that selling, even if the price still ended lower.
We’ll explore four key scenarios that arise from high or low volume at critical price levels. Since every trading day is unique, everyone should also conduct their own research to uncover additional variations.
When Price Hits the Ceiling: Spotting Breakouts and Reversals
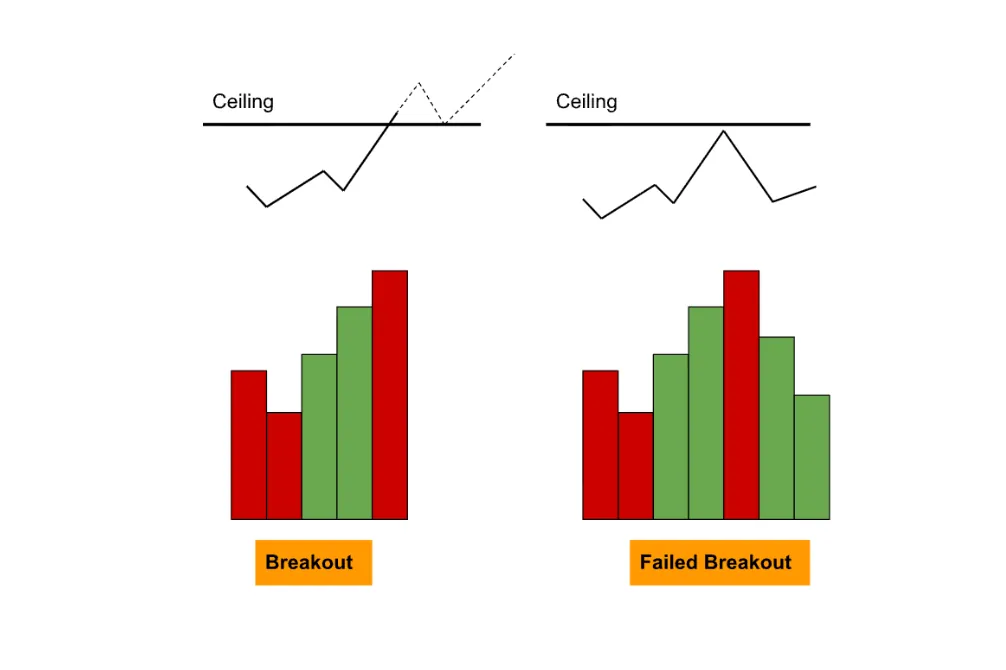
When the price hits the ceiling with high volume, a major battle is brewing between buyers and sellers. The high volume shows that a huge amount of shares are changing hands.
Breakout: If the price breaks through the ceiling, it signals that buyers have overwhelmed sellers. This is a powerful move and the new, higher price is likely to be sustained.
Failed Breakout: If the price fails to break through and gets pushed back down, it means sellers have successfully defended the ceiling. This is often a sign that buyer momentum is exhausted, and a reversal is likely.
High Volume at the Support: Spotting Breakdowns and Reversals
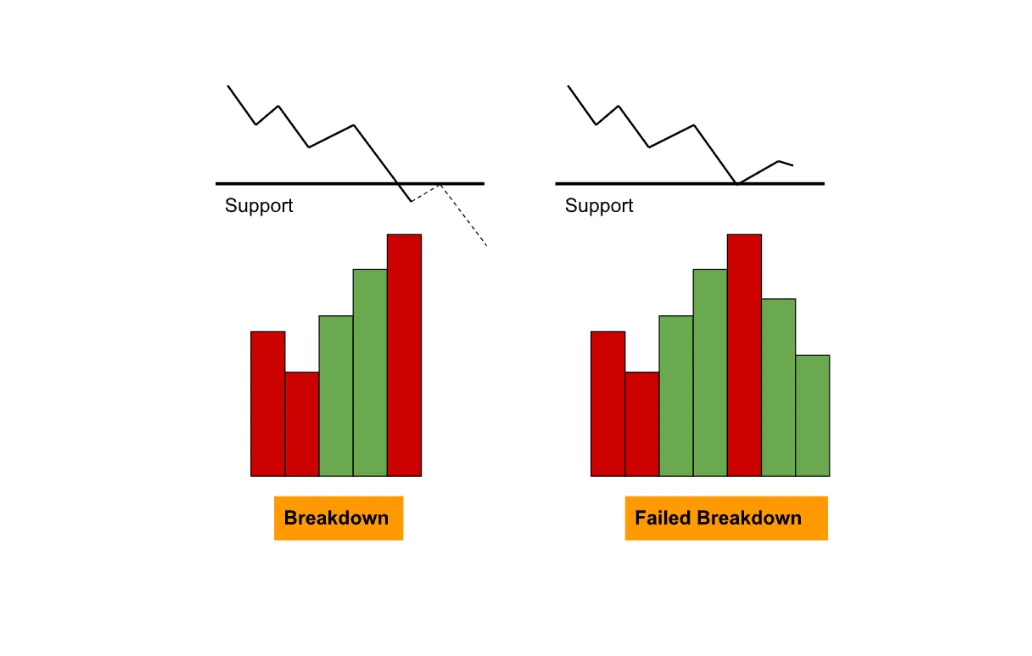
A price drop to the floor with high volume signals a major showdown. The market is testing the floor with immense force.
Breakdown: If the price breaks through the floor, it shows that the sellers were victorious and the foundation has been destroyed. This is a strong sign that the price will continue to fall.
Reversal: If the price holds its ground and reverses despite the high volume, it means that powerful buyers have stepped in and absorbed all the selling pressure. This is a very strong signal of a major reversal and is often called a “selling climax.”
Now, lets look at a real world example.
S&P 500
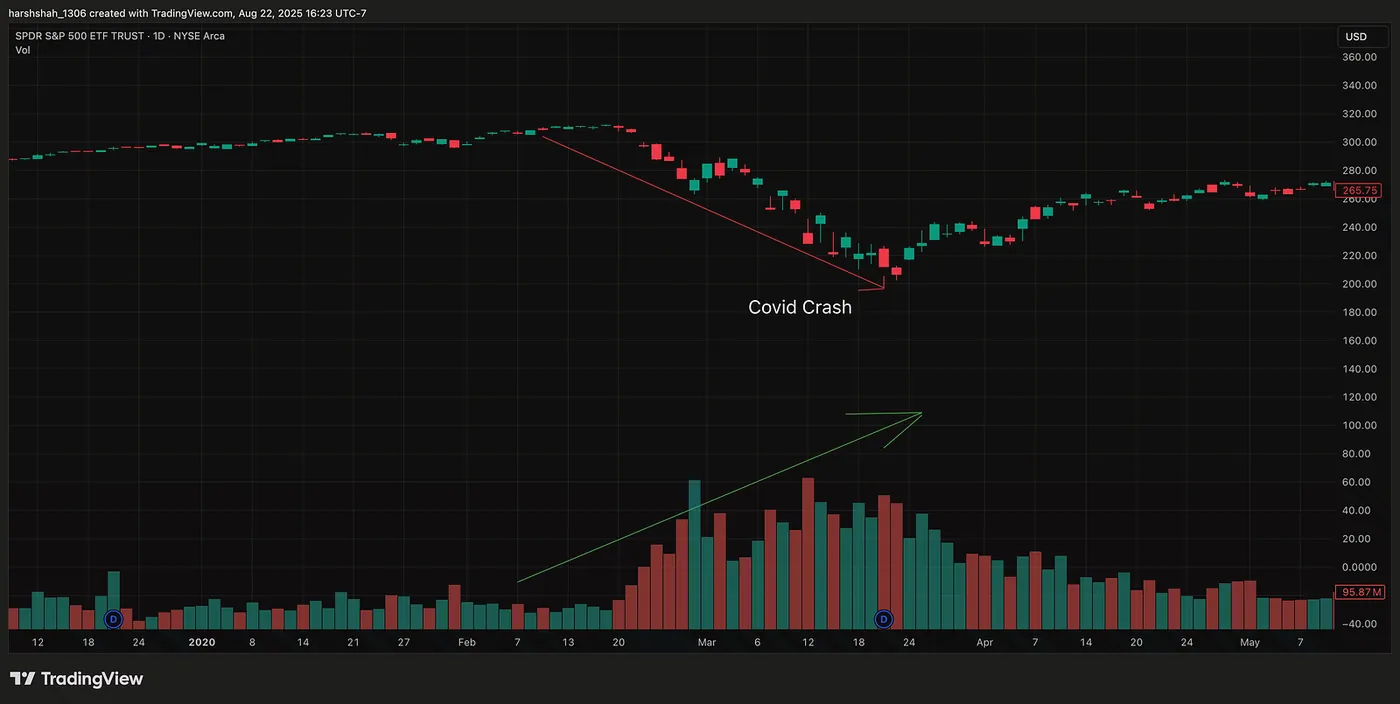
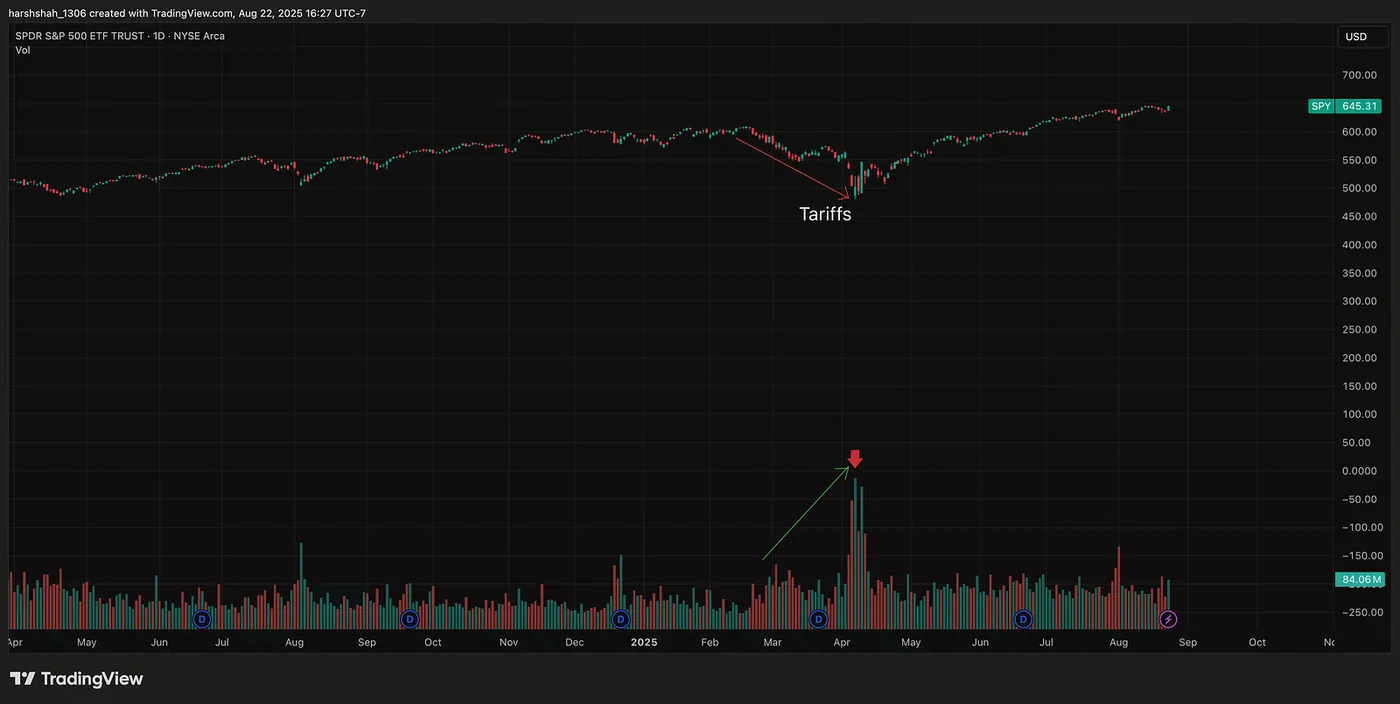
Both events — Covid Crash in 2020 & the recent Tariffs sell off saw a rapid and painful drop in the S&P 500, with prices falling toward key support levels. But this is where the story gets interesting. Instead of a breakdown, a massive surge in volume appeared on the weekly chart. This wasn’t just panic selling; it was a testament to the “battlefield” of the market.
At these critical support levels, sellers were unloading shares in huge quantities. But for every seller, there was an equally powerful buyer stepping in. The sheer size of the volume spike indicated that institutional investors and other market titans saw these lower prices as a once-in-a-generation buying opportunity.
The buyers won this fierce contest. Their collective force was strong enough to absorb all the selling pressure, preventing the price from falling any further. The result? The price held its ground, the downtrend was exhausted, and a powerful new uptrend was born.
Now, lets look at the complete picture.
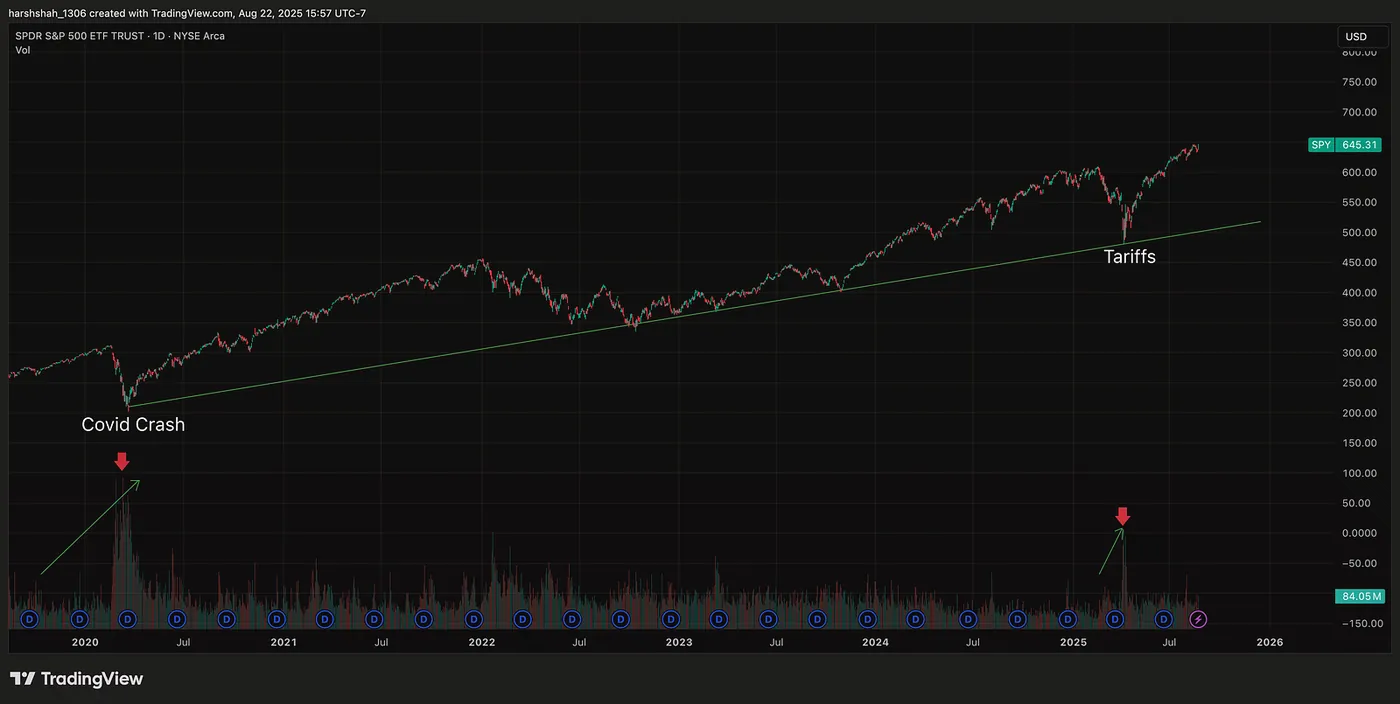
Combining the Key Support Line + High volume increases the probability of bounce to ~60–70%.
In both the events, volume acted as the ultimate confirmation signal. It told us the true psychology of the market: the selling was over, the foundation was intact, and a major reversal was on the horizon. This is the magic of combining price action with volume. It’s how we find conviction in the chaos.
Final Thoughts
We’ve learned that volume is the power behind the price, and it’s essential for understanding the conviction of any move. It tells us if a trend is real or just a fleeting moment. In our next chapter, we’ll dive deeper into the psychology behind support and resistance and how these key levels are formed.