Trendline Resistance setup · Updated Nov 7, 2026
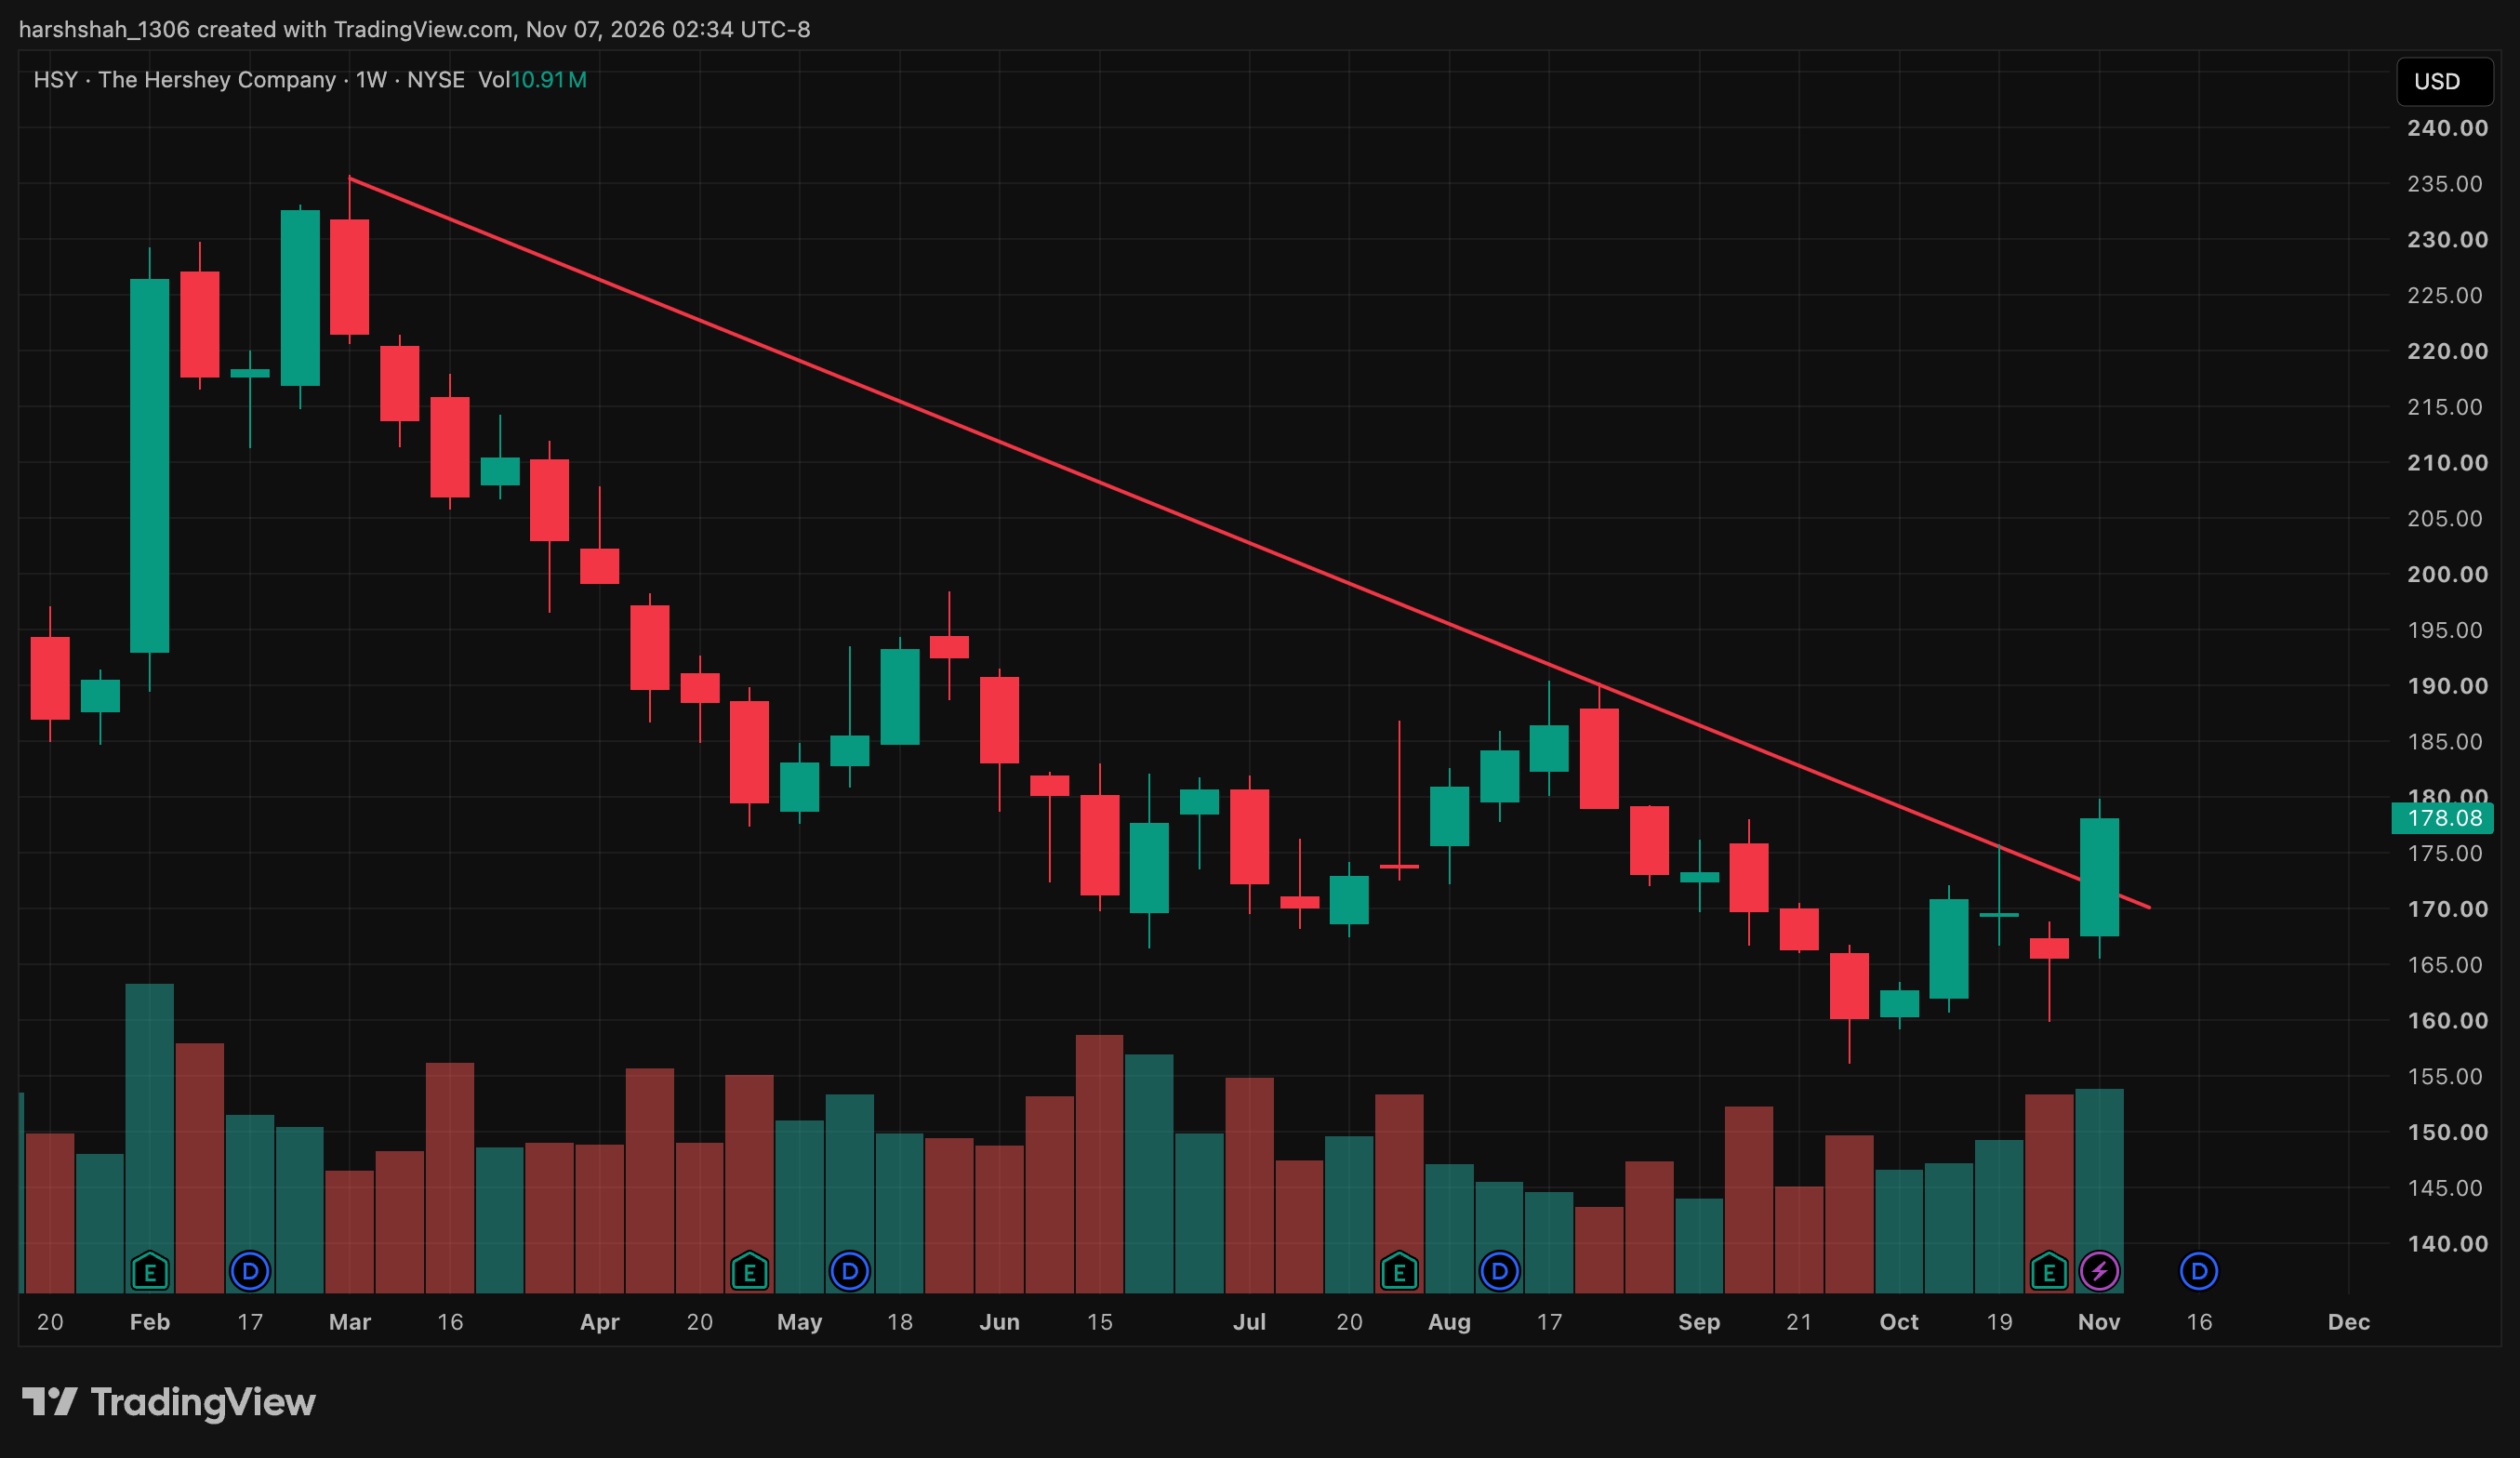
HSY has moved above trendline resistance at 175. Price action is now testing the breakout level to confirm whether this move has legs.
Data Driven Investing doesn't give buy or sell recommendations. As of the latest chart (Nov 7, 2026), HSY is in a Trendline Resistance setup with a breakout level at $175. Use these levels to plan your own entries, exits and risk, and remember the chart can change at any time.