Bitcoin Down 35%, MSTR Down 65% — Should You Buy? I’m Still Waiting. Here’s Why
By Harsh Shah · Updated
Disclaimer: This information is for educational purposes only and should not be considered financial advice.
Over the past month, Bitcoin has dropped nearly 35% — a kind of deep correction you rarely see in the middle of a bull market.
And while social media was screaming “BTC is going to $1 million!” at the top, I stayed focused on the only thing that has never lied to me:
The chart.
When Bitcoin tagged $126,000, it wasn’t euphoria for me — it was a red flag.
I’d already called out this long-term resistance zone in my first ever blog(must read), and this isn’t boasting; staying disciplined and ignoring the hype kept me out of a move that fell 35%.
Now BTC sits around $89,000, and the questions everyone is asking are simple:
Should we buy? Should we hold? Should we wait?
No one knows where Bitcoin will be next week or next year…
But technical analysis does give us something powerful: high-probability levels where price is likely to react.
And right now, the chart is pointing straight toward one zone: 75K–80K — lets break it down.
September 29, 2025
Bitcoin hits a new All time High ~1,26,000$.
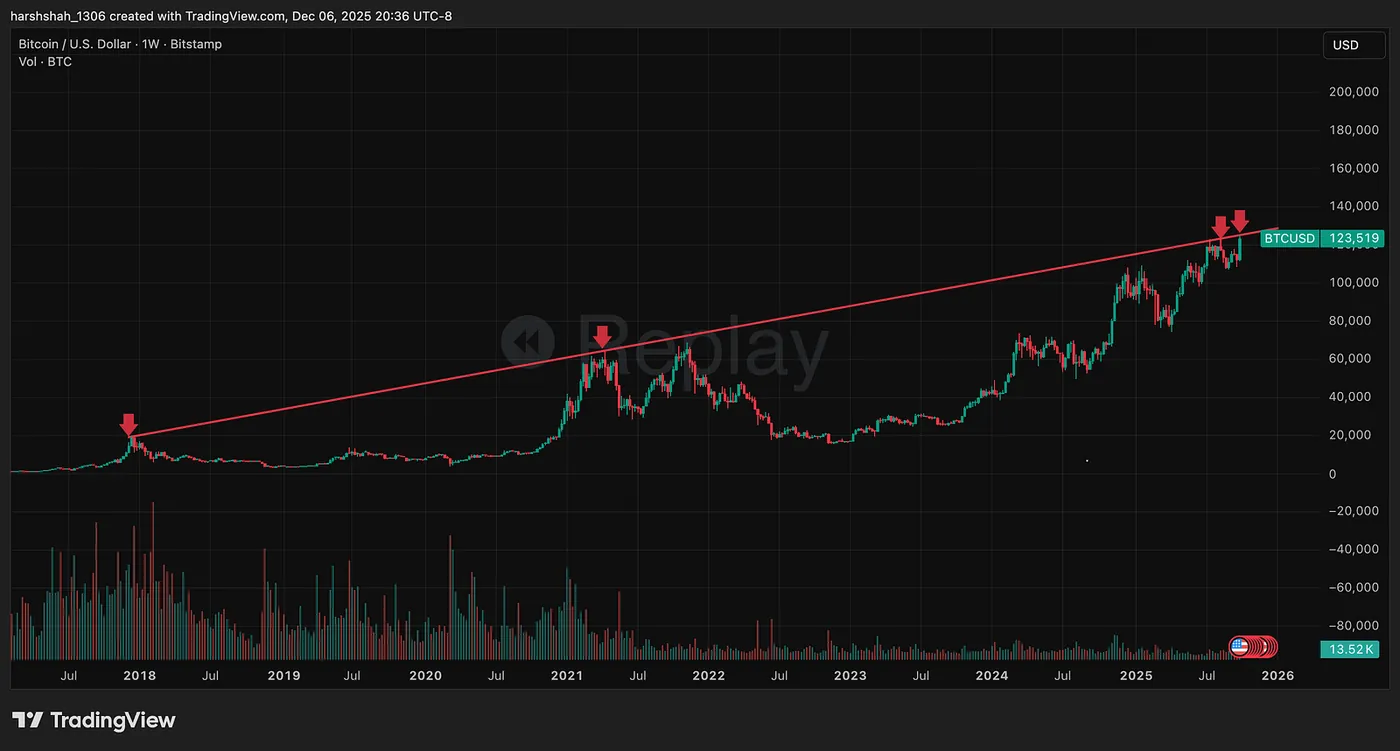
But here’s the catch — it also ran straight into long-term resistance.
From the 2017 peak to 2021, and now again in 2025, Bitcoin keeps hitting and respecting the same trendline. This level has acted as a ceiling since 2017, and BTC still hasn’t been able to close above it with conviction.
Did I buy at these levels ? Absolutely Not.
I waited patiently and let the chart guide my next move, where the probability of a rejection was far higher.
Aggressive Trades did even short at these levels!
Fast Forward to Today — December 7, 2025
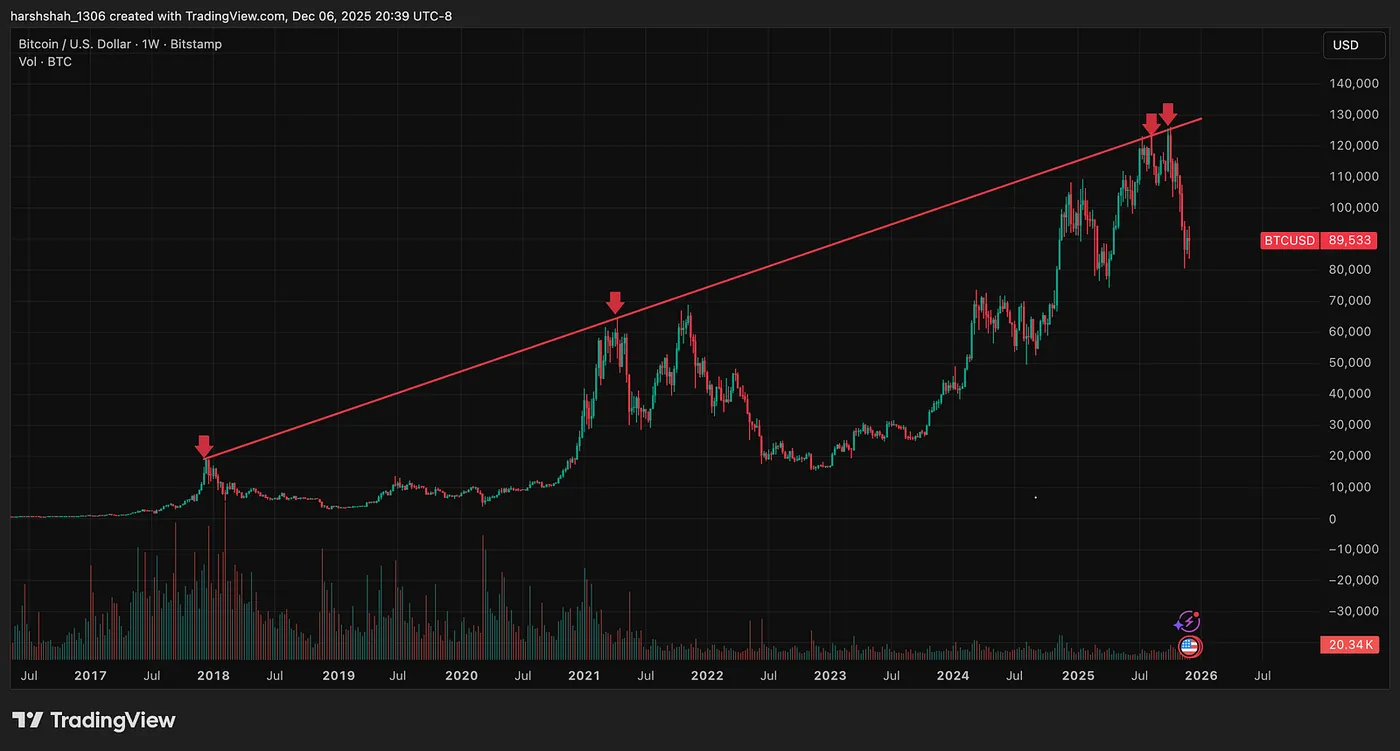
With BTC down 35%, the real question becomes:
a) What’s a good level to enter if you believe in Bitcoin?
b) And more importantly: Are you accumulating long-term, or are you swing trading?
Once you know your goal, technical analysis becomes your compass.
Where Is Support? Why BTC Held ~80K and Bounced
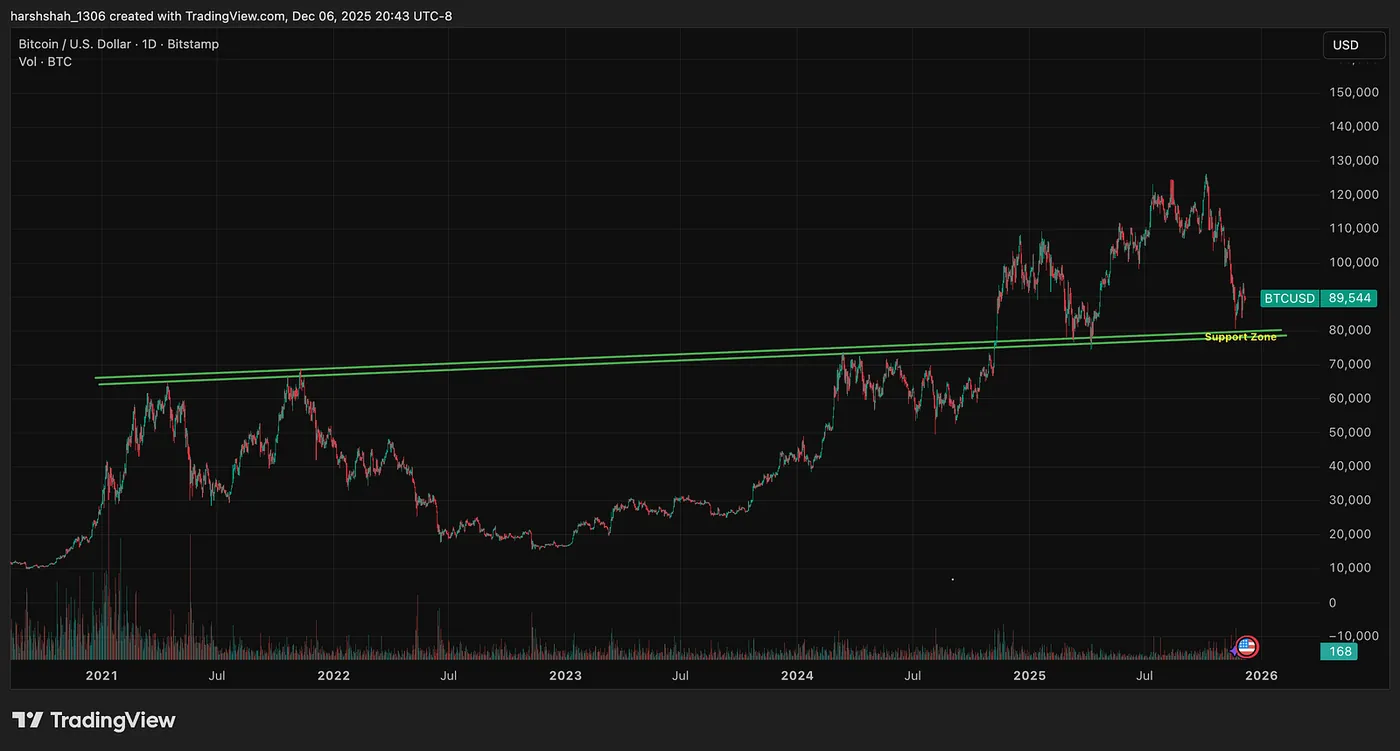
I had my buy zone slightly below 80K — and Bitcoin never quite flushed through it.
Did I miss the trade? Yes — by 600$Am I upset? Not at all.
There will always be another opportunity.
The chart shows a strong support zone between 75K and 80K, and price respected it beautifully.
Zooming In: BTC Is Forming a Bear Flag
While Bitcoin bounced from the 80.5k price, the price action is indicative of the formation of a bearish pattern — Bear Flag.
Bear flag is a bearish pattern(inverse of BULL flag), read more about ithere.
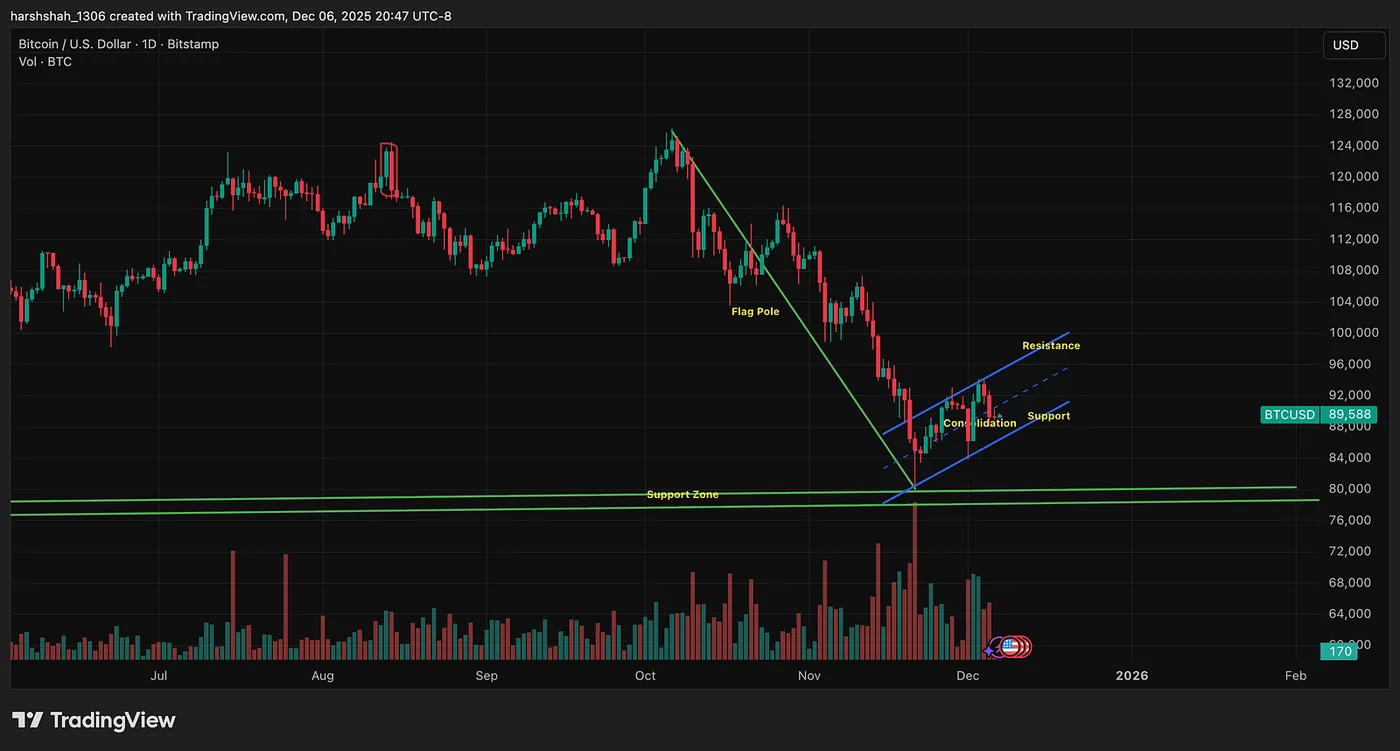
A bear flag typically signals further downside if price breaks below the consolidation.
So for now, I’m doing nothing.
I’m simply watching the chart, waiting for price to approach the support zone, and preparing to act when the setup is clean.
My Plan
Long-Term:
➡️ Start nibbling if BTC enters the 75K–80K zone
➡️ Add gradually, not all at once
Swing Trades:
➡️ Enter only with a strict stop-loss
➡️ Exit if BTC closes below support
Always Analyze BTC First — MSTR is Just the Leverage Play
While Bitcoin dropped 35%, MSTR fell 65%.
That’s the nature of a leveraged proxy — it amplifies both the upside and the downside.
So the rule is simple: Track BTC’s price action. Trade MSTR for leveraged returns.
Final Thoughts
The point is simple:
Analyze the 10,000-foot BTC chart first, then zoom in, then take action.
That’s technical analysis.
Also, Next time you hear
“Bitcoin is going to $1 million!”,
don’t FOMO.
Pull up the chart and let the price action guide you.
Because behind every candle is the behavior of billions of humans trading fear and greed — and technical analysis helps us interpret that story better than most.