Understanding the Bull Flag Pattern
Amazon and Trade Desk Bull Flag Pattern: Could This Signal a 40%+ Rally Ahead?
By Harsh Shah · Updated
Disclaimer: This information is for educational purposes only and should not be considered financial advice.
Have you ever seen a stock rally hard, pause briefly — and then suddenly explode higher again?
That’s often a Bull Flag in action — one of the cleanest, most reliable continuation patterns in technical analysis.
Let’s break it down 👇
What Is a Bull Flag?
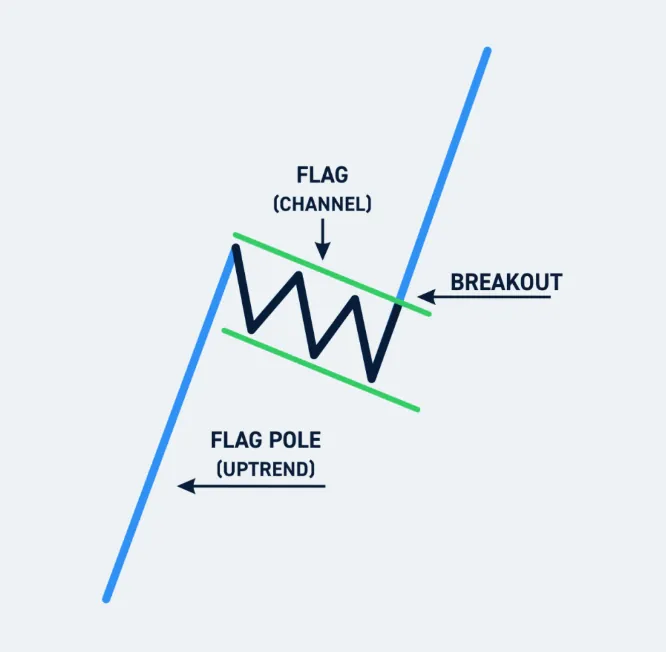
A Bull Flag forms during a strong uptrend when prices take a short breather before resuming their move higher.
Visually, it looks just like a flag on a pole:
- The flagpole represents the sharp, almost vertical price surge.
- The flag is the small, downward-sloping consolidation that follows.
This pattern tells you:
Buyers are still in control — they’re just catching their breath before the next leg up.
The Structure of a Bull Flag
A valid Bull Flag usually has three clear stages:
- Flagpole:
A sharp, high-volume rally — often driven by news, breakout, or momentum buying. - Flag:
A short period of consolidation or mild pullback, typically slanting downward (or moving sideways).
This happens because short-term traders take profits while new buyers wait for a better entry. - Breakout:
The price breaks above the upper trendline of the flag on rising volume — signaling that the uptrend is resuming.
The Psychology Behind the Pattern
The Bull Flag works because it reflects a pause in buying momentum, not a reversal.
- After a strong rally, short-term traders take profits, creating a brief pullback.
- At the same time, new buyers wait for a more favorable entry point.
- Once the selling pressure fades, demand returns — driving prices higher again.
It’s a psychological rhythm of the market: momentum → rest → continuation.
How Traders Use It
Bull Flags are loved by swing and momentum traders because they:
- Provide clear entry and exit points
- Offer defined risk (stop-loss below the flag’s low)
- Often lead to explosive moves if volume confirms the breakout
Typical trade setup:
- ✅ Entry: Breakout above flag’s resistance line
- ❌ Stop-Loss: Just below the flag’s support
- 🎯 Target: Equal to or greater than the length of the flagpole
Key Rules:
The angle of the flag plays a major role in determining the probability of success.
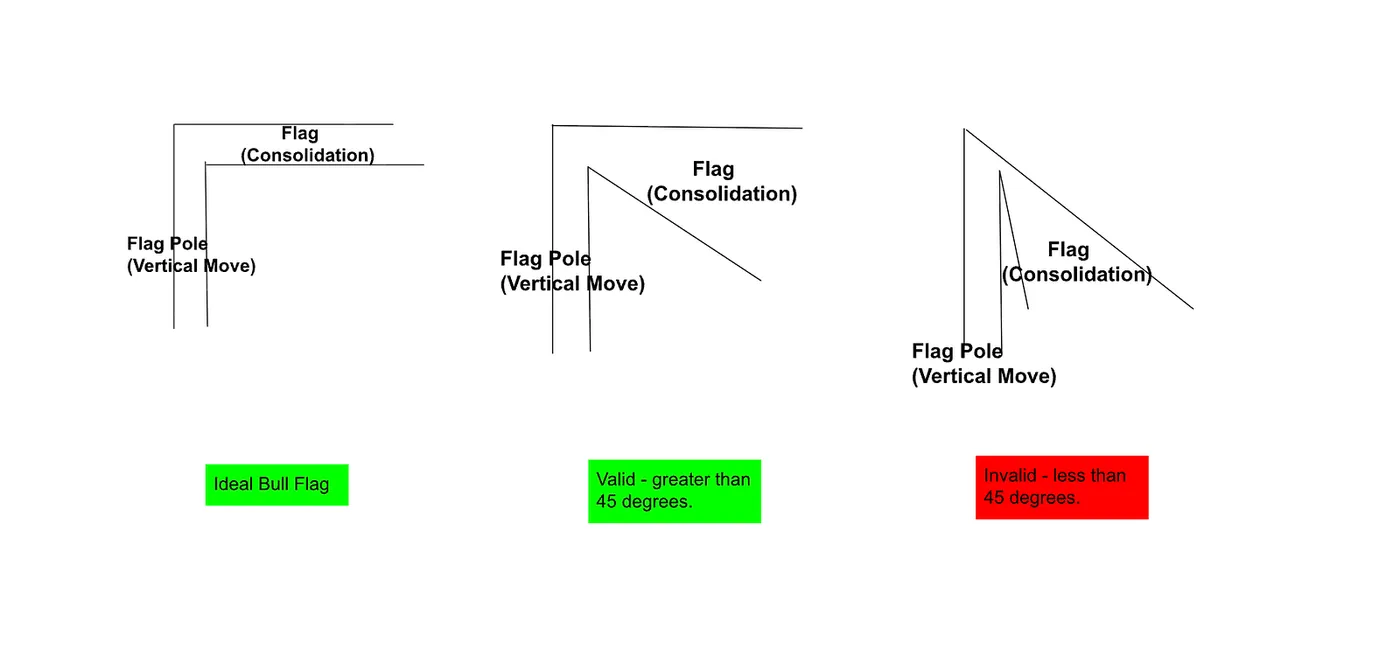
- A 90° angle represents a textbook Bull— the strongest setup.
- Angles below 90° are still valid but tend to have lower reliability.
- When the flag’s angle drops below 45°, the odds of success fall sharply — often below 50/50.
Note: The Flag pole doesn’t need to be verticale, it can be at an angle (usally 45–90°)
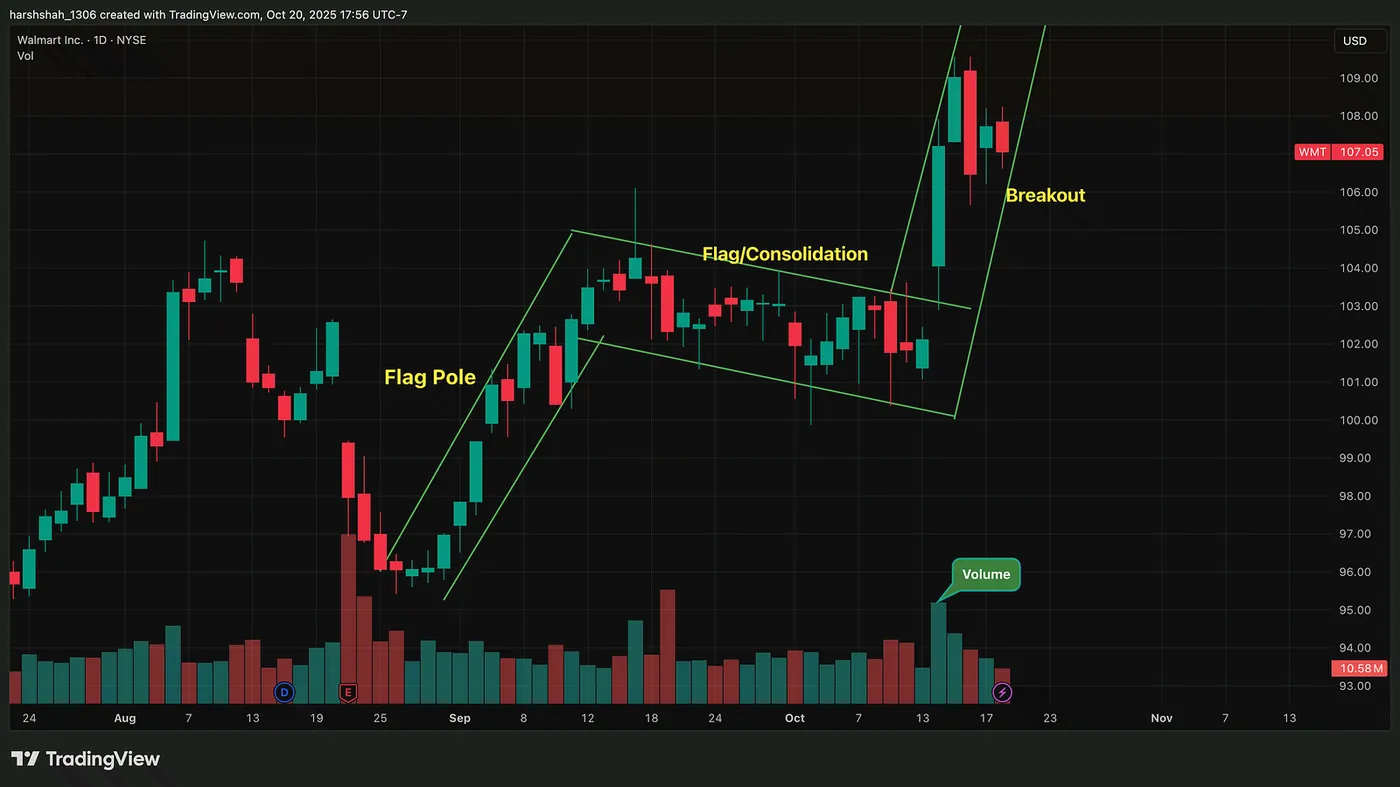
Walmart — Bull Flag Breakout in Play
The initial uptrend started in August, followed by a consolidation phase. Later, there was a breakout from the consolidation pattern, signaling an uptrend.
This is a classic bull flag in Play.
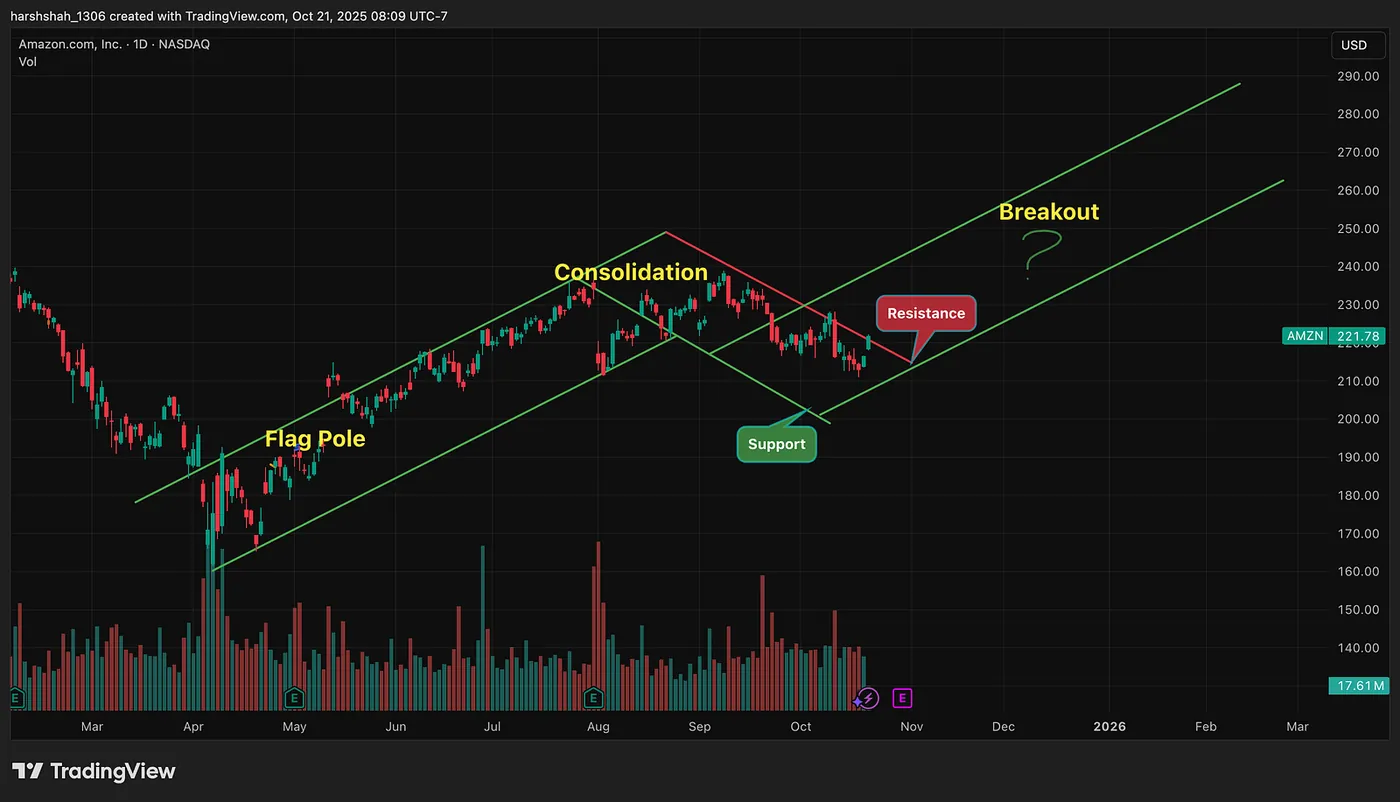
Amazon — BULL Flag, will it Play out ?
After rallying from its April lows around $170 to nearly $230, Amazon entered a consolidation phase and has been range-bound for the past two months. A breakout above resistance with confirmation could signal the next leg higher — potentially toward the $300 level.
Note: the bull flagpole angle is somewhere around 45°, so we should wait for additional signals for higher probability setup.
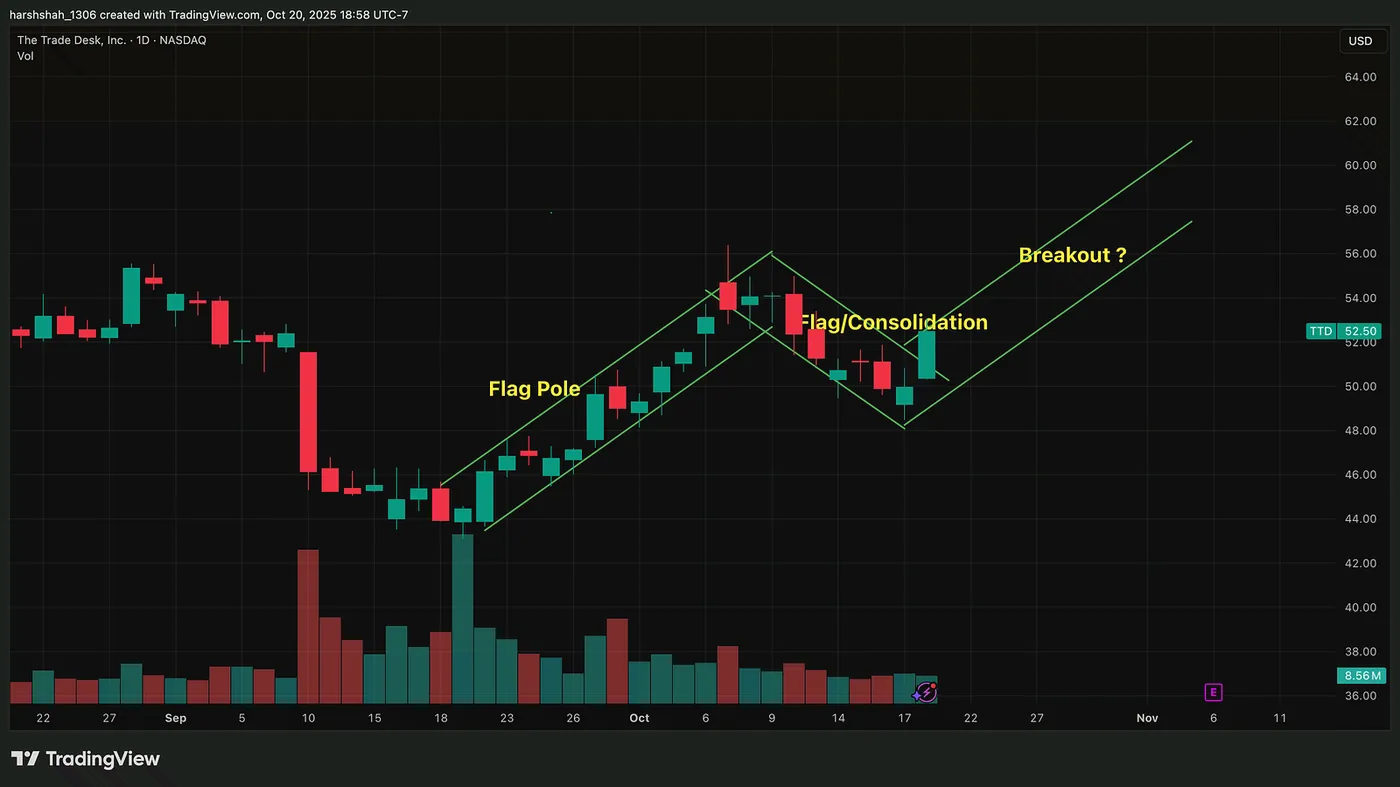
TTD — BULL Flag, will it Play out ?
Trade Desk has broken out of its consolidation phase and is now showing an upside move, potentially heading toward the $60 level.
Final Thoughts
The Bull Flag may look simple, but that’s exactly what makes it powerful.
It captures one of the most reliable behaviors in markets: momentum, pause, continuation.
So the next time you see a stock run hard, then gently pull back — don’t look away. It might just be forming a Bull Flag getting ready to fly again 🚀
I’m creating a full technical analysisseriesthat breaks down chart patterns — from consolidations and wedges to breakouts and reversals — using real-world examples.