Understanding Consolidation
38%+ Gains in Tesla, Intel, and Zscaler Using This Trading Psychology
By Harsh Shah · Updated
Disclaimer: This information is for educational purposes only and should not be considered financial advice.
Ever felt like your stock just won’t move?
You start doubting your pick.
Should you sell/Cover ? Should you hold?
What if I told you — this “boring” phase has its own psychology,
and once you understand it, you’ll know exactly what to do next.
An Impatient Investor: Mr. Tom
Meet Mr. Tom — He did his research, analyzed the charts, and found a stock he truly believed in.
He bought it at $650, confident it would rise.
But as we all know, not everything moves right away.
Weeks passed. Then months. The price barely moved.
It tested his patience every single day.
After six long months of sideways action, Tom gave up and sold.
And just one month later, the same stock shot up to $1000.
Those six “boring” months?
That was consolidation — the quiet phase before the breakout.
The market wasn’t ignoring him; it was simply preparing its next move.
What Exactly Is Consolidation?
Consolidation simply means the market is taking a breather.
It’s that period when prices trade in a narrow range — up one day, down the next — without making new highs or new lows.
Think of it as the market catching its breath after a sprint.
Buyers and sellers are battling it out, and neither side has a clear upper hand yet.
In simpler terms:
The trend pauses.
The volatility cools off.
Everyone’s waiting for the next direction.
Why It Matters
Most traders ignore consolidation.
They think, “Nothing’s moving, I’ll check another chart.”
But those who understand it know: consolidation builds pressure.
And when that pressure finally releases — price tends to move sharply, either up or down.
The longer the price stays stuck, the bigger the breakout when it finally escapes.
How to Spot It on a Chart
You don’t need fancy tools or indicators.
Just open a chart and look for these signs:
- Flat Price Movement — The price moves sideways for several sessions or weeks.
- Clear Range — You can draw a line where price keeps bouncing from top and bottom.
- Small Candles — The candles are shorter, showing lower volatility.
- Lower Volume — Trading activity slows down — people are waiting.
It looks like the market is asleep, but in reality, it’s preparing its next move.
What Happens Next?
Once one side wins — either buyers or sellers — the price breaks out of that range.
That breakout often marks the beginning of a new trend.
- If price breaks above the range → buyers take control.
- If price breaks below the range → sellers take control.
Example:
Imagine a stock trading between $100 and $110 for three weeks.
One day, it closes above $110 on strong volume.
That’s your cue — the market just woke up.
How I Use It in My Trading
Whenever I see a consolidation, I don’t rush in.
I mark my range and wait for price to show its hand.
When it finally breaks above or below with momentum — that’s when I act.
This simple routine has helped me:
- Avoid random trades
- Enter only when there’s confirmation
- Stay aligned with the bigger moves
The best part? It keeps emotions out of the picture.
No guessing. Just reacting to what price tells you.
Common Mistakes to Avoid
- Jumping too early: Don’t guess the breakout direction before it happens.
- Ignoring volume: Strong moves are usually supported by higher trading volume.
- Forcing trades: If it’s still in range, stay patient. The move will come.
Remember — consolidation is not a signal to trade.
It’s a signal to prepare.
Lets dive deeper into some real world examples:
TSLA — The breakout after consolidation
One of the strongest pattern of consolidation is known as a wedge pattern Note: we’ll do a dedicated post/blog to under wedge pattern in detail.
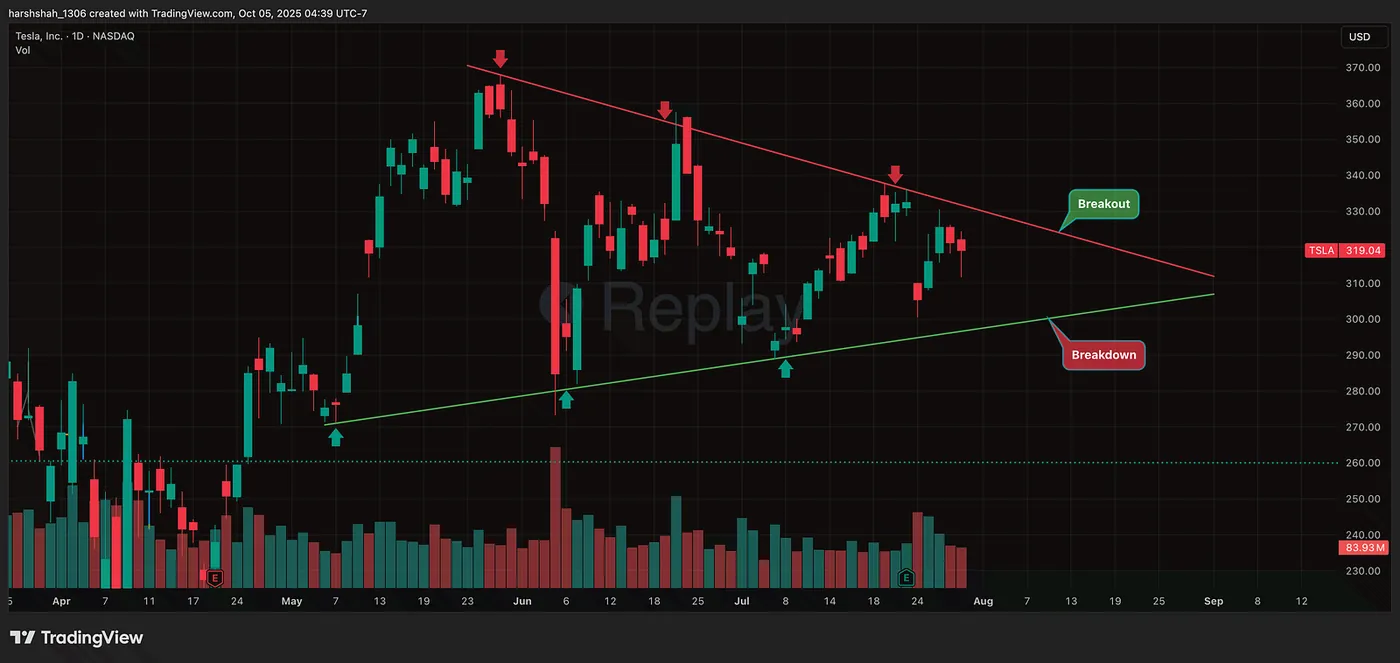
July 30
From mid-May through the end of July, Tesla traded sideways in a tight, indecisive wedge.
The red line served as resistance and the green line acted as solid support.
The market was consolidating, and the best strategy during this period was to wait patiently to see which direction the stock would ultimately break out.
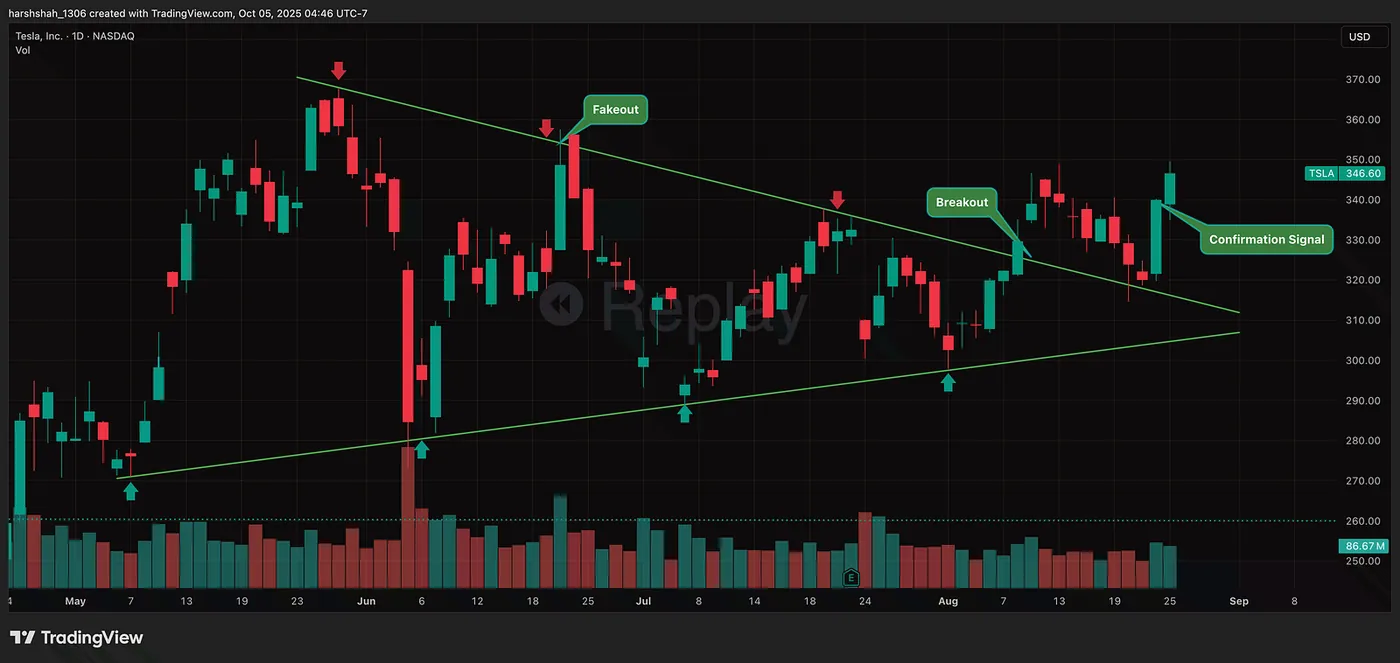
August 8th & 25th
Finally, August 8th, we saw a breakout, but was it a fakeout ? For confirmation, there needs a confirming close above the resistance line.
On August 25th, the breakout was confirmed, i.e. the candle close above the high of the breakout candle.
The resistance, now becomes support!
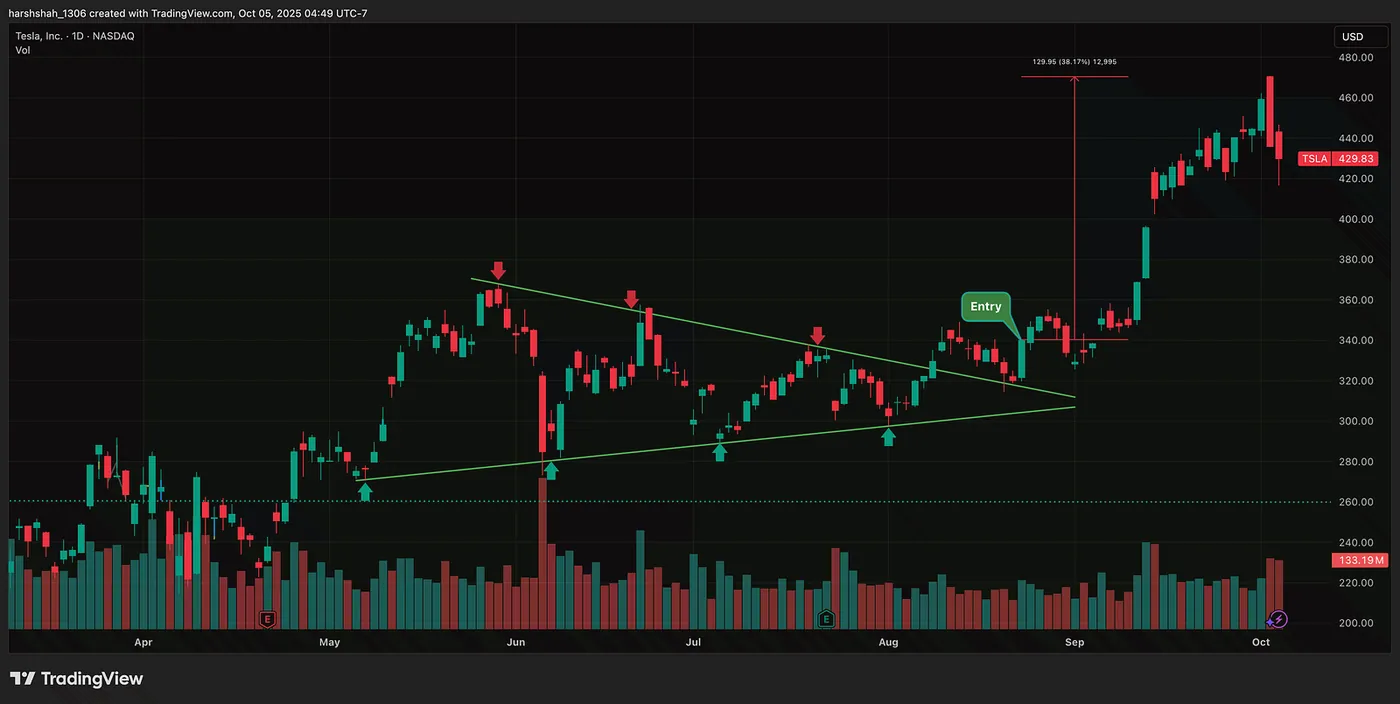
This is where the long entry should be initiated ~340$.
TSLA: The final rally: 38% rally in 40 days
The consolidation phase concluded, immediately triggering a rapid, 38% rally over the next 40 days.
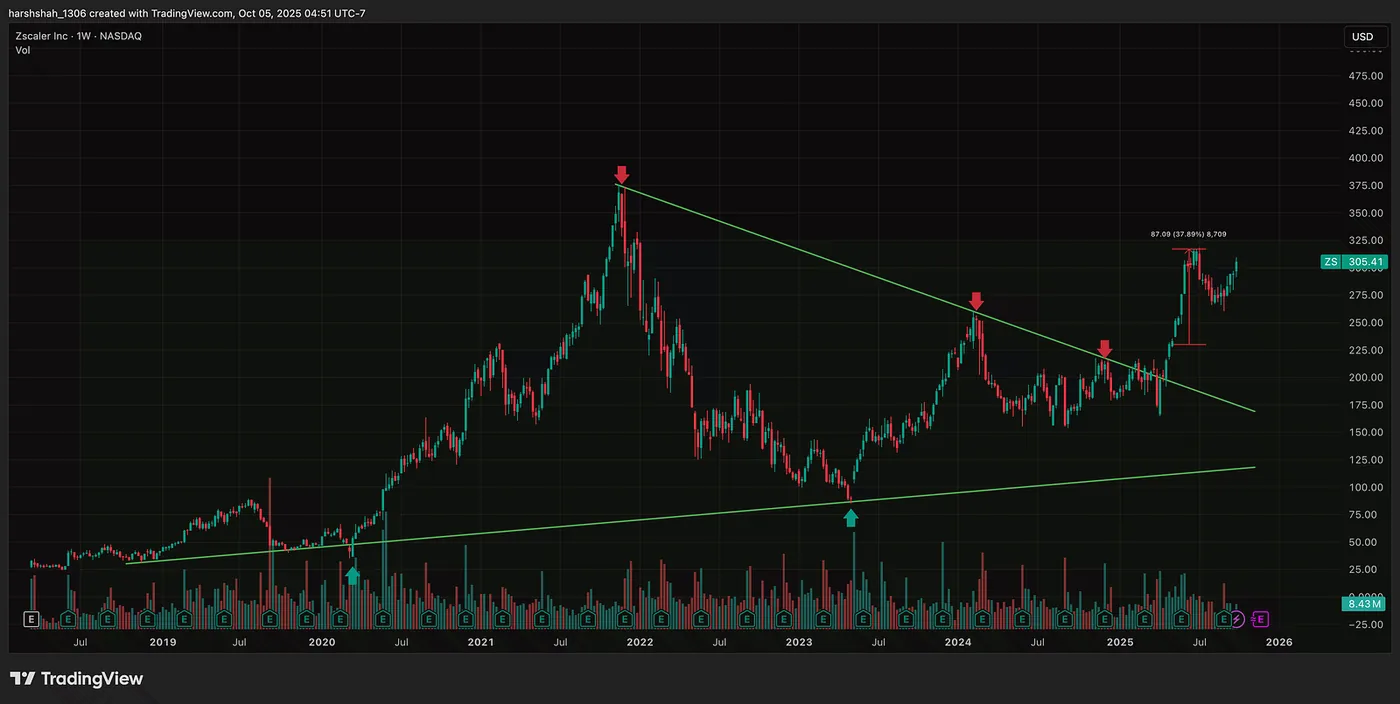
ZScaler: A 38% Rally
Stocks can remain trapped in a wedge pattern for years, but the eventual break constitutes a potent buy signal. We saw this play out recently with
ZScaler: its wedge breakout immediately triggered a 38% rally to the upside.
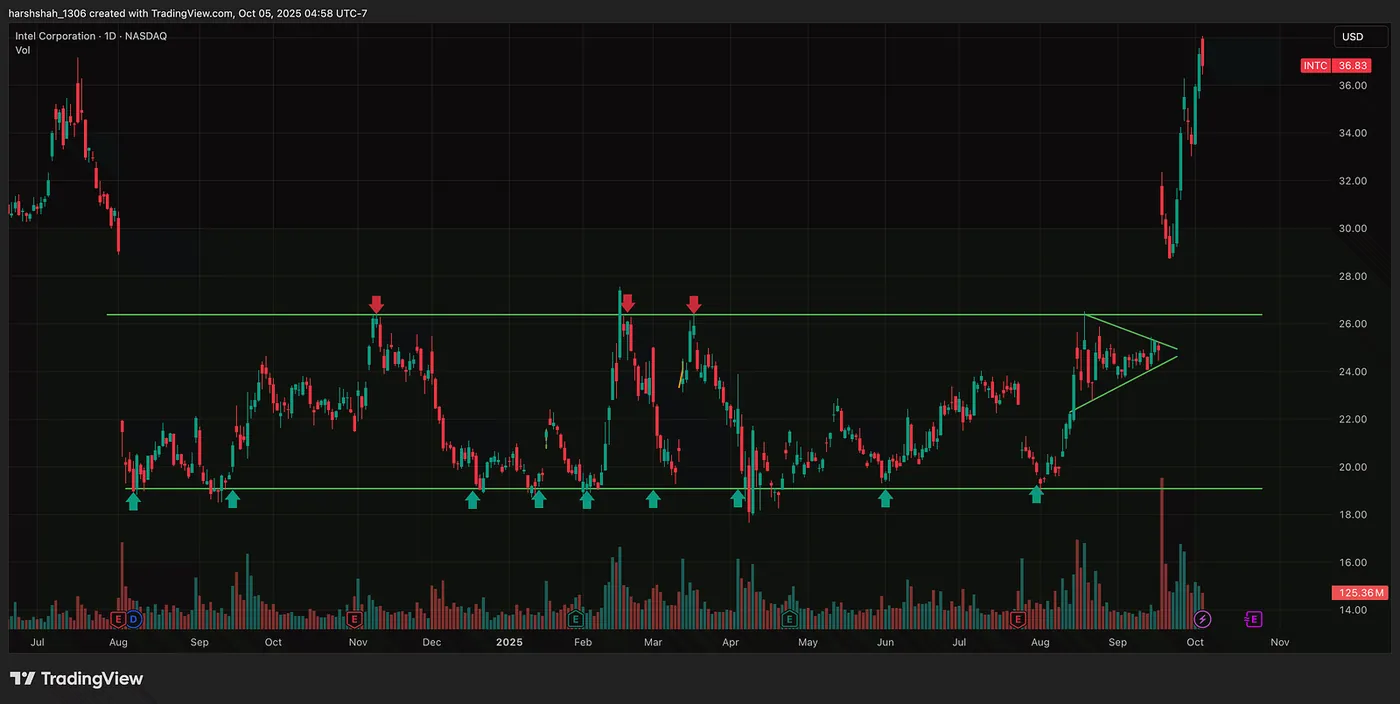
INTC — A Monstrous rally ~50%
After consolidating in a tight range between $19 and $26 for over a year, Intel finally broke out. This decisive move fueled a powerful 50% rally to the upside, driving the stock to a close of $37 in less than a month.
Final Thoughts
Consolidation is the market’s way of taking a breath before the next run.
It’s calm, quiet, and often ignored — but it hides some of the best opportunities.
So next time you see a sideways chart, don’t scroll past it.
Mark the range.
Wait for the breakout.
And when it comes, let the market do the heavy lifting.
I’ve created a full technical analysis series to simplify investing for everyone. You can find the complete content here.