OXY: A Rare 3-Factor Setup With ~35% Upside Potential
By Harsh Shah · Updated
Disclaimer: This content is for educational purposes only and should not be considered financial advice.
Finally… I’ve found a setup that checks almost every box I look for.
This is the kind of structure where multiple factors align:
✅ Inverse Head & Shoulders breakout
✅ 8 EMA crossing above 21 EMA (momentum shift)
✅ Target aligning directly with a major resistance trendline
When structure and momentum line up together, probabilities improve.
That doesn’t mean it can’t fail — technical analysis is always probability.
But these are the kinds of setups I pay attention to.
Let me walk you through the thought process.
📚 Before We Proceed
If you’re new to these concepts, you may want to review:
These ideas will make the setup much easier to understand.
August 2022 — The Resistance Test
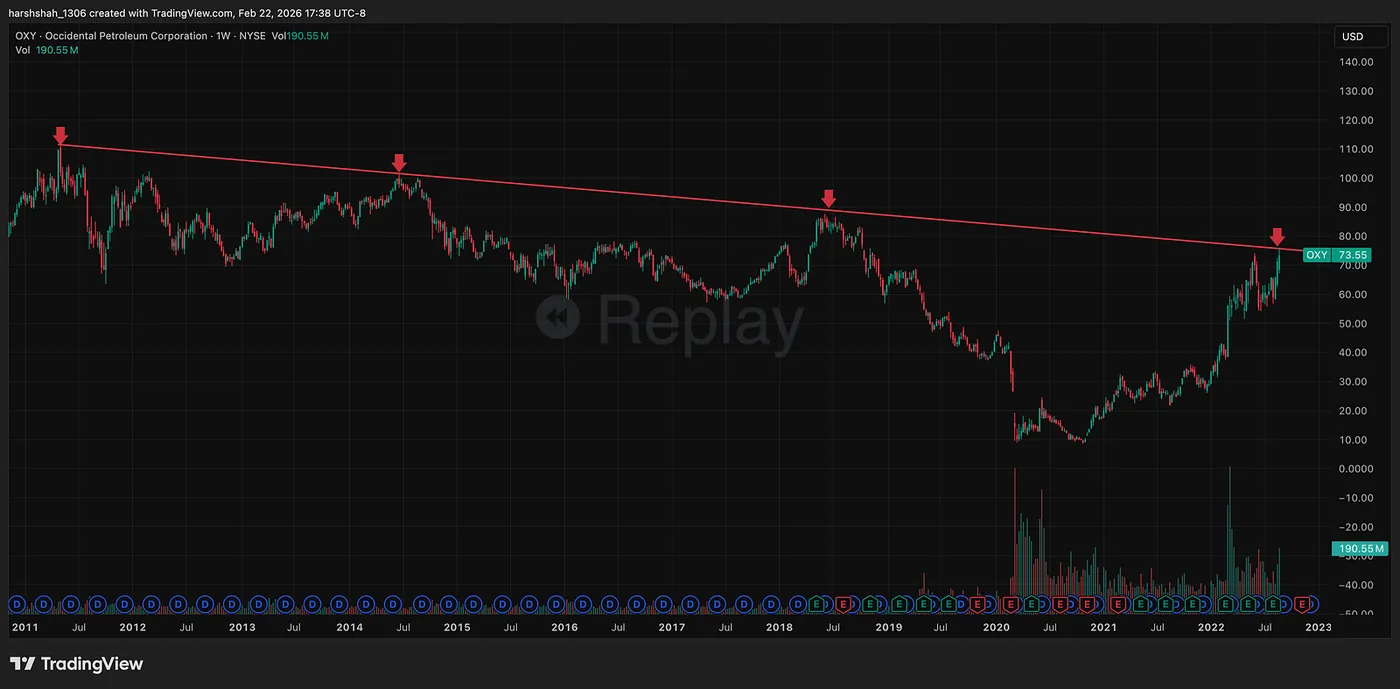
OXY reached a major long-term trendline resistance.
Was I a buyer there?
Absolutely not.
When price hits strong resistance, the probability of rejection is high.
At that point, there were only two logical outcomes:
1️⃣ Resistance breaks → bullish continuation
2️⃣ Resistance holds → pullback or consolidation
The only smart decision was to wait for price to reveal direction.
Patience is a strategy.
April 2024 — Resistance Gets Tested Again
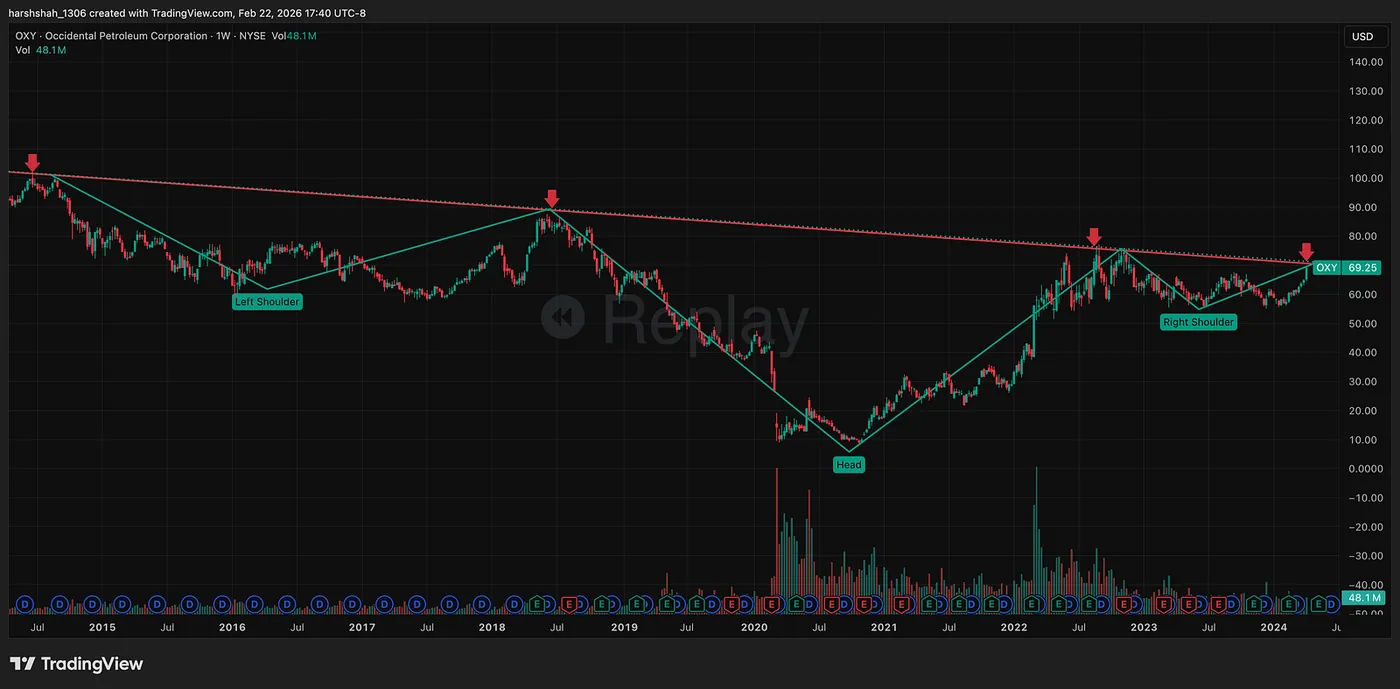
Price once again approached the same trendline.
But this time something interesting was forming:
An inverse head & shoulders structure.
If a breakout happened there, it would have been a very high-quality trade.
But instead of trying to predict the breakout…
I waited.
Because price confirmation matters more than anticipation.
February 22, 2026 — Momentum Shift Begins
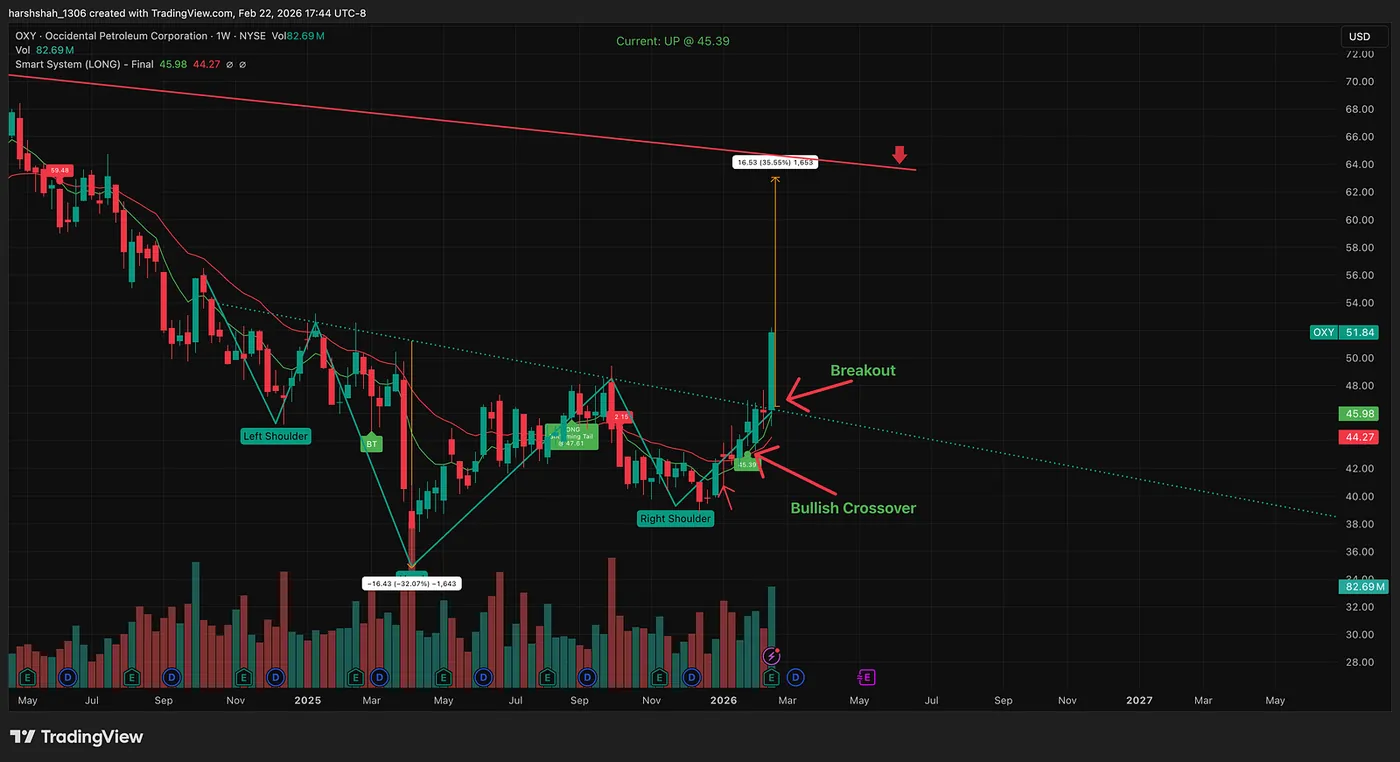
Price pulled back from resistance and consolidated.
If a company is fundamentally strong, resistance eventually breaks — but timing matters.
So I added OXY to my watchlist.
Then something important happened:
A new inverse head & shoulders formed — and broke out last week.
That was Factor #1 that caught my attention.
The 3 Factors Aligning
✅ Factor 1 — Inverse H&S Breakout
A structural shift from distribution to accumulation.
✅ Factor 2 — EMA Momentum Flip
8 EMA crossed above 21 EMA near $45.39.
Momentum turned bullish.
✅ Factor 3 — Target Meets Resistance
The projected move aligns directly with the long-term resistance line.
That’s about ~35% upside potential.
When targets align with major structure, the trade becomes more interesting.
⚠️ Risk Reminder (Important)
Even with 3 factors aligned:
The setup can fail.
Markets don’t guarantee outcomes.
If you trade:
- Manage risk
- Size appropriately
- Respect invalidation levels
Or simply watch it for education.
Both are valid.
🧠 A Critical Truth
Technical analysis works best when fundamentals are supportive.
If the underlying business weakens, patterns can fail quickly.
Always combine:
👉 Technicals + Fundamentals + Risk Management
📩 Want More Setups Like This?
I share chart setups I’m watching here:
👉 datadriveninvesting.io
You can sign up for alerts — completely free.
Final Thoughts
This is one of the cleaner setups I’ve seen recently.
What excites me most is not just the trade — but the process.
My indicator helped surface this opportunity early, and now we watch how price behaves.
Will it play out?
I don’t know.
And that’s okay.
Because trading is not about certainty.
It’s about probabilities.
Let’s see how this develops over the coming weeks.