Understanding Wedge Patterns
S&P 500 Faces Pressure, CVNA Pulls Back, ENPH Eyes a Breakout
By Harsh Shah · Updated
Disclaimer: This information is for educational purposes only and should not be considered financial advice.
Ever looked at a chart that seems to be “squeezing tighter” — the swings get smaller, volatility fades, but something feels ready to explode?
That’s not your imagination.
That’s a wedge pattern — one of the most powerful consolidation formations in technical analysis.
When you spot it right, it often signals the calm before a massive move.
What Exactly Is a Wedge?
A wedge pattern forms when price movements get squeezed between two converging trend lines — one sloping down and the other sloping up.
It’s a sign that momentum is fading, and a breakout is near.
Think of it like a spring being wound tighter — the more it coils, the more powerful the release.
I categorize the wedges into three types
1️⃣ Falling Wedge — The Bullish Setup
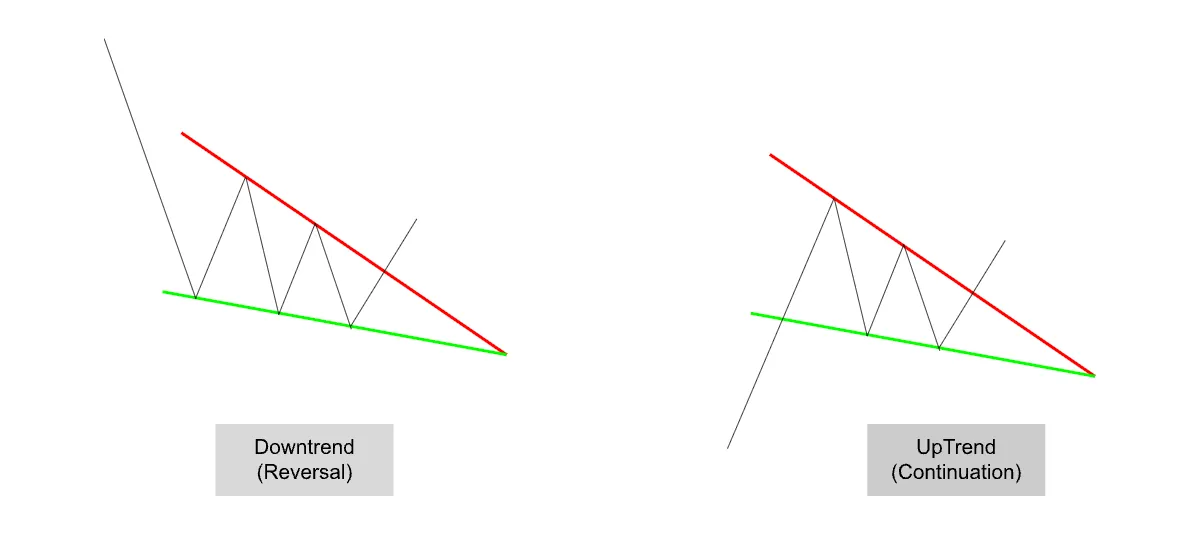
- Shape: Both trendlines slope downward.
- Meaning: Price is falling, but sellers are running out of steam.
- Psychology: Each drop gets shallower — buyers are slowly gaining strength.
Eventually, the price breaks above the upper resistance line — often triggering a sharp bullish reversal.
Note: The probability of an upward breakout is high because, even if the price initially breaks down from the pattern, the downfalling wedge’s intrinsic bullish nature suggests an eventual reversal and move to the upside.
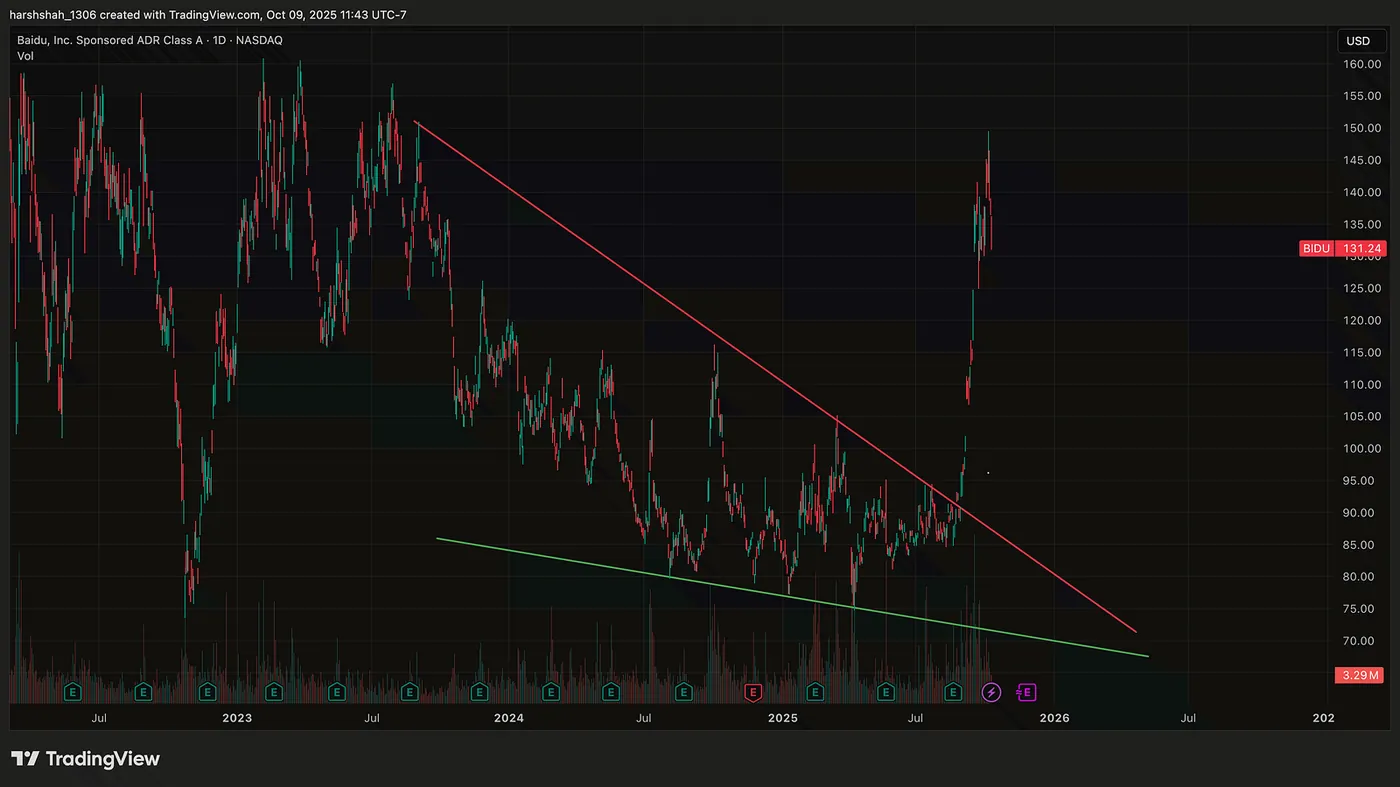
BAIDU — Downsloping wedge breakout: a 60% Rally
Following a prolonged period of consolidation in a falling wedge through late 2023, Baidu’s stock staged an impressive performance. A major breakout in September fueled a powerful, month-long rally, rocketing the share price from 92$ to a high of 150$ — a gain of 60%.
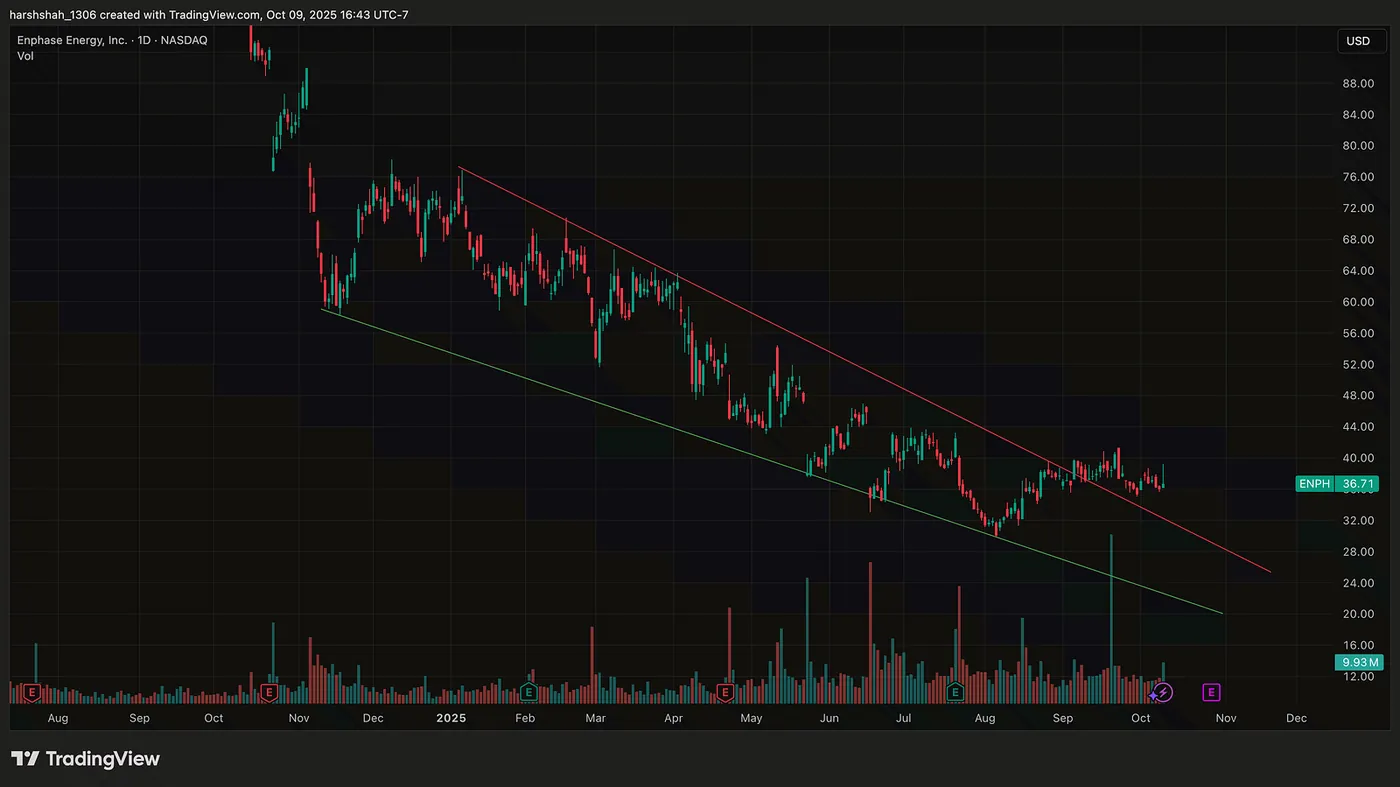
ENPH — A Reversal on the Horizon?
Enphase Energy (ENPH) has successfully broken out of its falling wedge formation, a classic technical signal often pointing to a bullish reversal. This development suggests selling pressure may be exhausted, and we will watch the price action closely over the next few weeks to see if a sustained uptrend begins.
2️⃣ Rising Wedge — The Bearish Setup
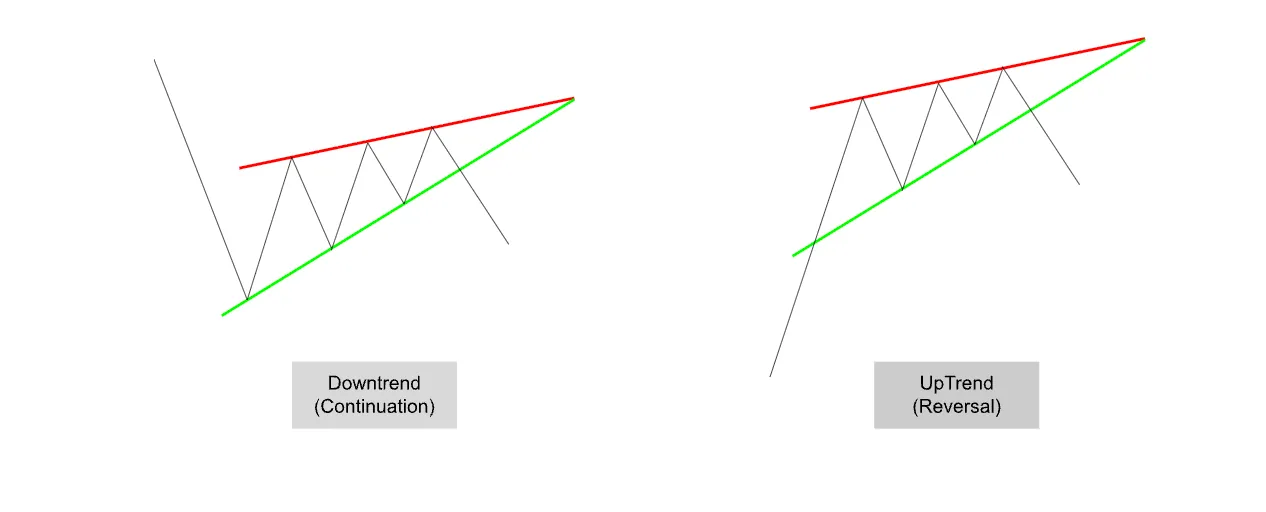
- Shape: Both trendlines slope upward.
- Meaning: Price is rising, but buyers are losing momentum.
- Psychology: Each push higher is weaker — sellers are quietly preparing to take control.
Eventually, the price breaks below the support line w/ confirmation — signaling a bearish reversal.
The probability of a downward breakout is high because, even if the price initially breaks up from the pattern, the upsloping wedge’s intrinsic bearish nature suggests an eventual reversal and move to the downside.
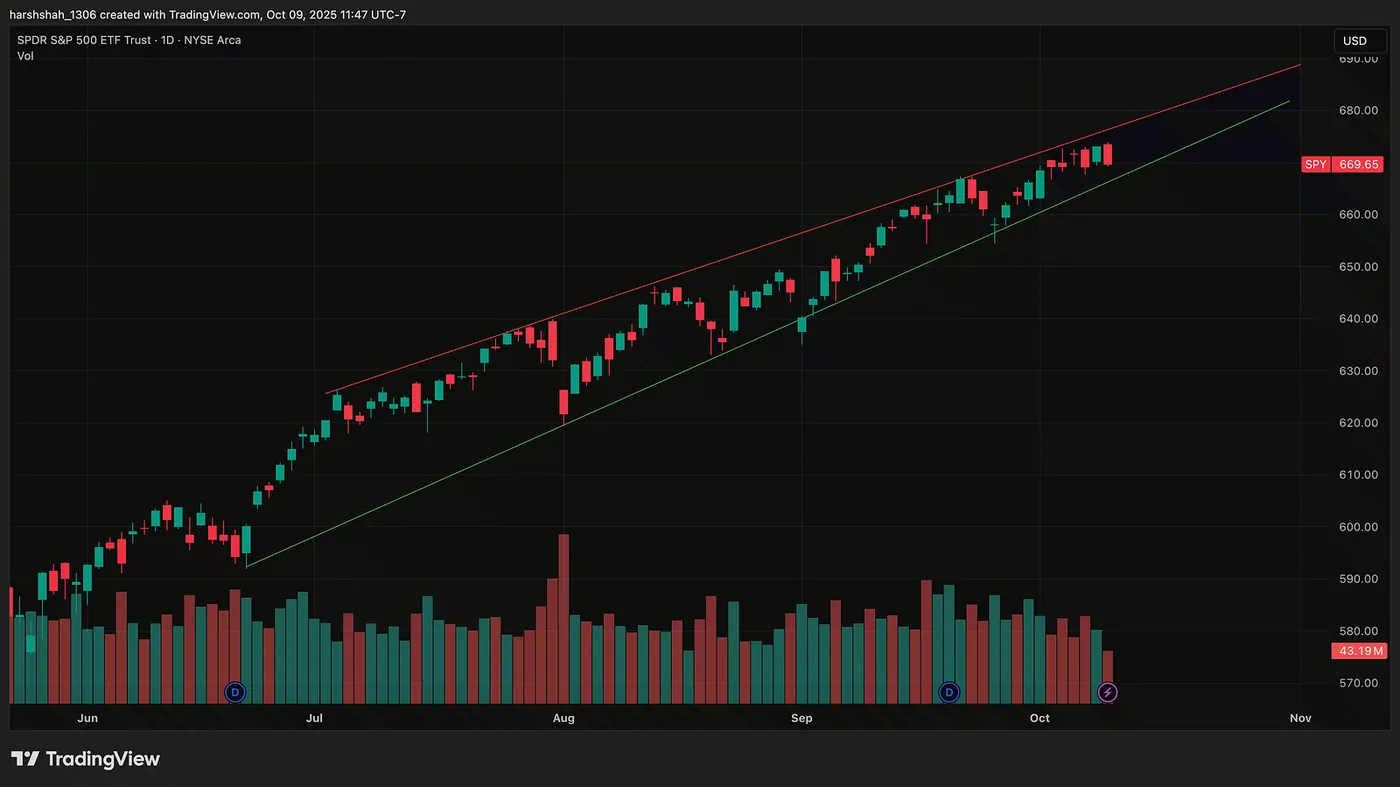
SPY — A major breakout on the horizon
The SPY has been contained within a rising wedge pattern since June, characterized by a slow, upward grind. The confirmed breach of the wedge’s support line would serve as a powerful signal, indicating the potential for a significant downside correction.
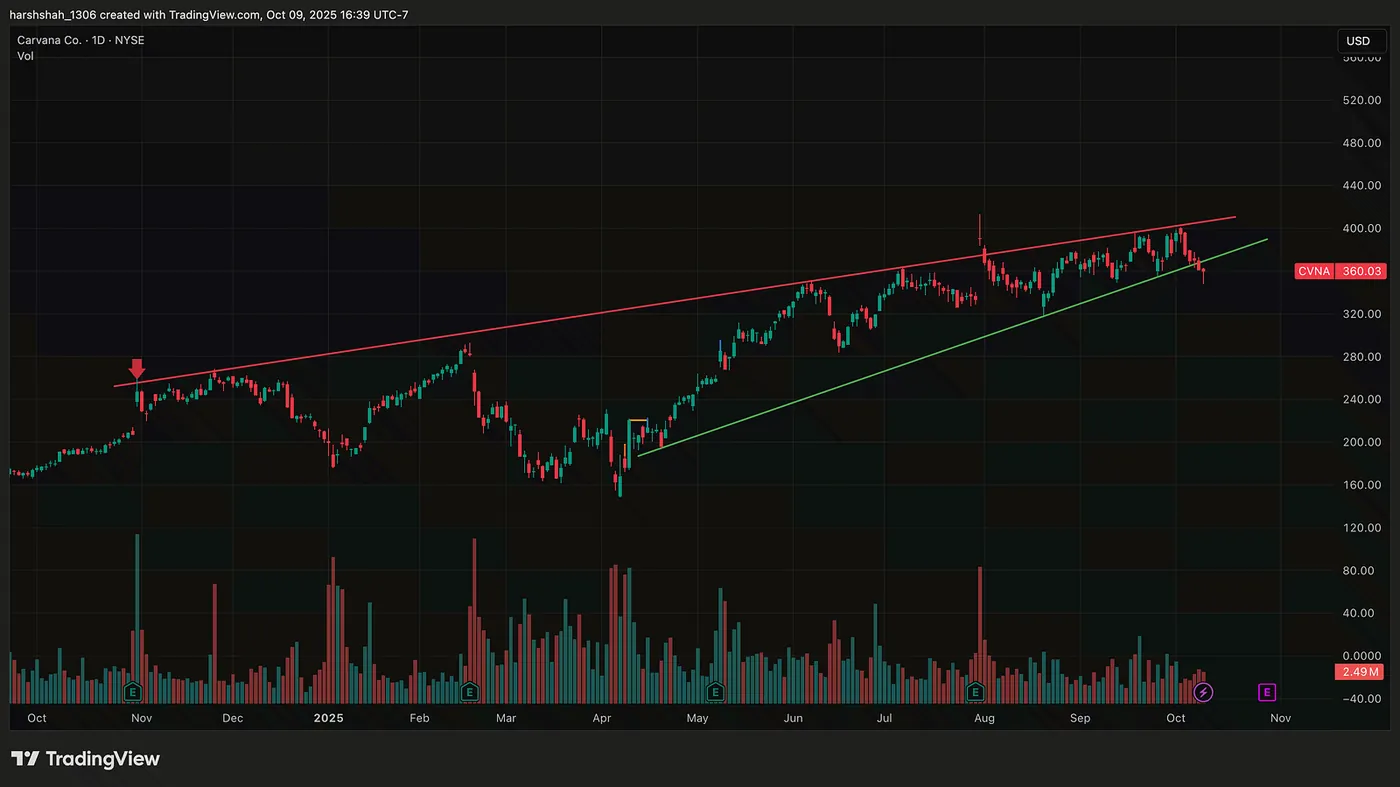
Carvana — Rising Wedge broken, pending confirmation
Carvana has breached the support line of its rising wedge pattern, but this breakdown is not yet confirmed. If confirmation occurs, the former support level will likely become new resistance, signaling a potential move to the downside.
3️⃣ Indecisive Wedge — Wait and follow
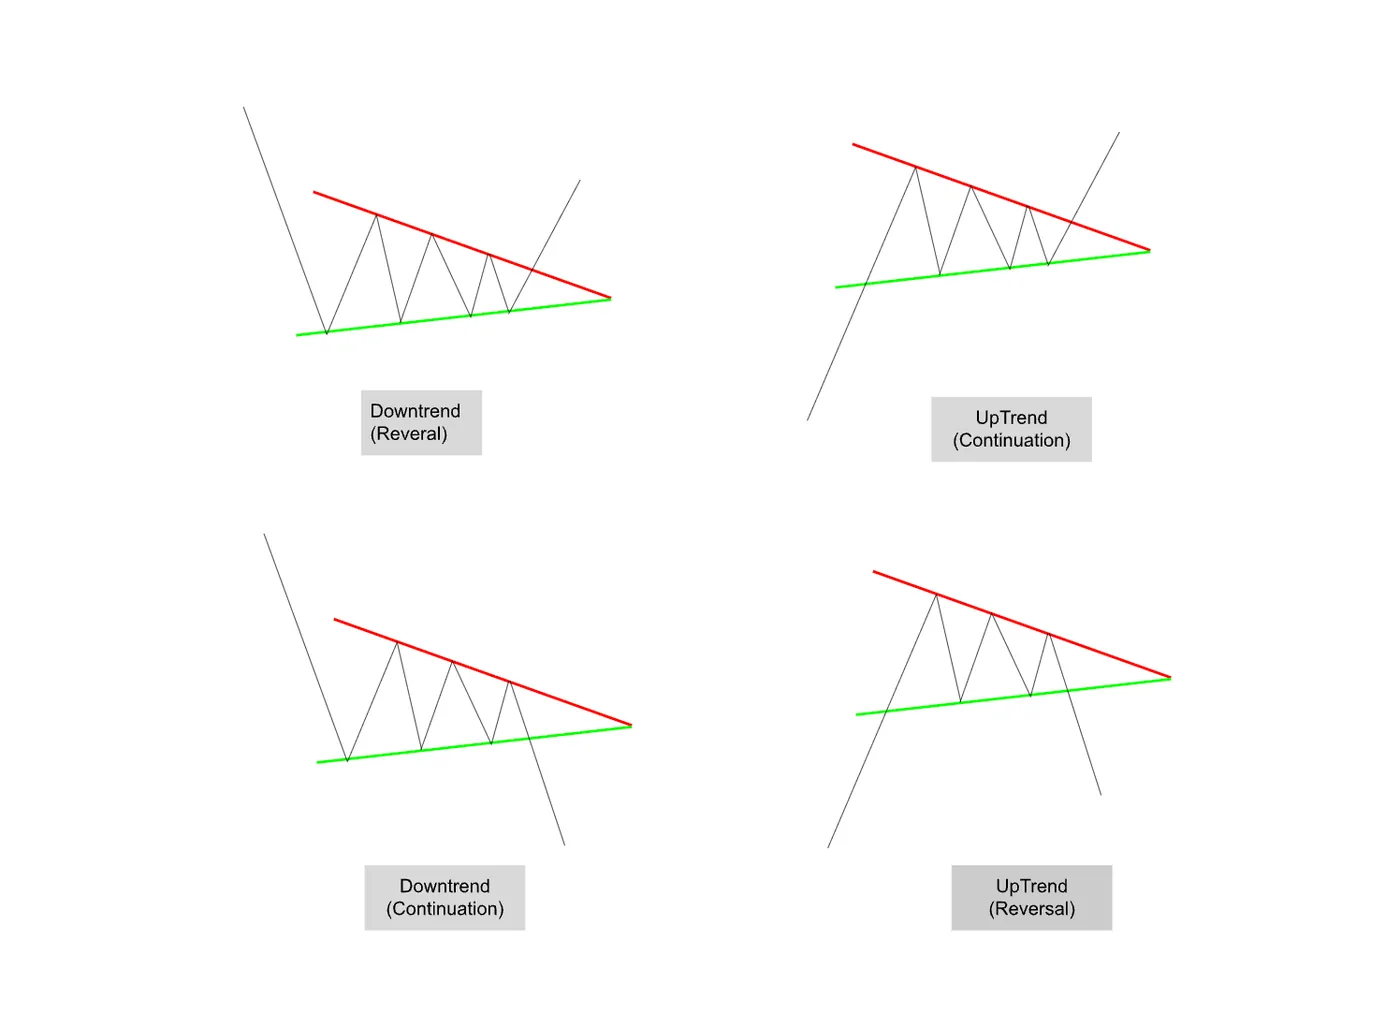
- Shape: Both trend lines converge — one slopes down, the other slopes up.
- Meaning: Price is coiling tightly, with neither buyers nor sellers clearly in control.
- Psychology: Each rally is met with selling, and each dip finds support — a tug of war that builds tension.
Eventually, the price breaks out in either direction — the move that follows is often sharp, as trapped traders rush to adjust their positions.
👉 Typically forms after a strong move (up or down), signaling a pause before the next big trend.
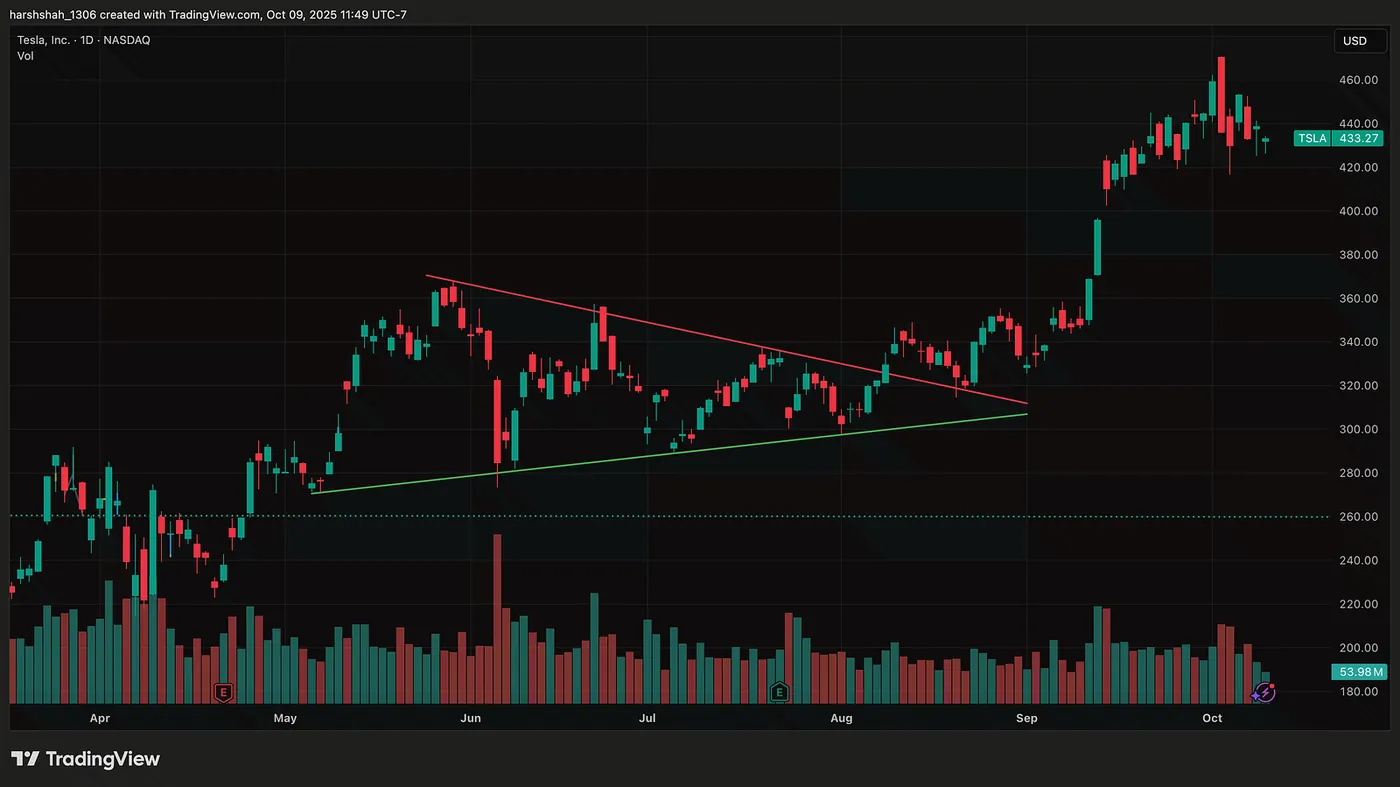
TSLA — Indecisive wedge, breakout to the upside!
After being contained in an indecisive wedge pattern, Tesla stock finally resolved to the upside. This breakout delivered a fantastic 38% return to investors.
The Psychology Behind Wedges
Wedges are all about tension.
Every candle tells you the battle between buyers and sellers is tightening — nobody’s winning yet.
But the losing side always reveals itself first.
When they finally give up, that’s your breakout.
That’s why seasoned traders love wedges — they let you anticipate momentum shifts before the crowd notices.
Trading a Wedge
- Wait forConfirmation: Always hold your entry until the price has decisively broken out of the wedge and that move is confirmed.
- Define Your Risk: Place a stop-loss order to exit the trade if the price reverses and re-enters the wedge pattern, confirming the failure of the breakout.
- Avoid Guesswork: Do not attempt an early entry. Entering before confirmation is pure speculation, which is gambling, not trading.
Final Thoughts
Wedges are one of the clearest examples of how market psychology shapes price action.
They show hesitation, tightening conviction, and then — a sudden explosion of clarity.
So next time you see the price compressing between two lines, don’t ignore it.
It’s the market whispering:
“Something big is coming.”
Mark it. Wait for confirmation. Then ride the move.
I’m creating a full technical analysis series that breaks down chart patterns — from consolidations and wedges to breakouts and reversals — using real-world examples.