Bitcoin at $75k–$80k: A Make-or-Break Technical Level
By Harsh Shah · Updated
Disclaimer: This content is for educational purposes only and should not be considered financial advice.
Bitcoin has finally reached the support zone I’ve been waiting for: $75k–$80k.
This isn’t a random level.
I called out this exact zone (75–80k) back on December 18th, with the full chart setup published here.
Sign up with your email to get notified when key chart setups are published at datadriveninvesting.io/chartsetups-us.
So… am I jumping in right now?
Not yet.
And there’s a very good reason for that.
Let me explain.
Quick Context (Worth Reviewing)
To follow this properly, it helps to understand:
These concepts matter a lot at major inflection points like this.
October 2025: Bitcoin reaches an all-time high near $126k
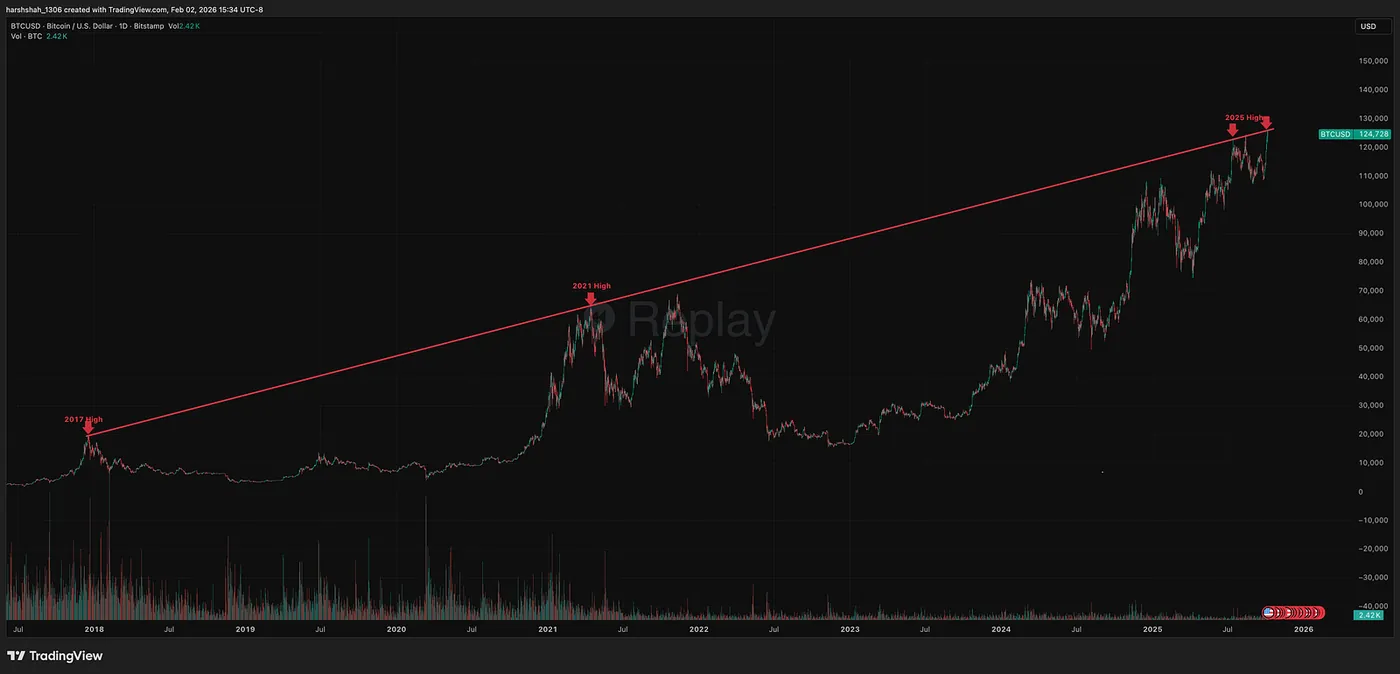
One of the greatest strengths of technical analysis is knowing when not to buy — and when it’s time to sell.
When Bitcoin was trading near $126k, the chart was screaming resistance.
That wasn’t a buying opportunity — it was a warning, with a red trendline connecting the 2017, 2021, and now the 2025 highs.
Feb 2, 2026: Retesting a key support zone after a 40% correction
Since then, Bitcoin has corrected nearly 40%.
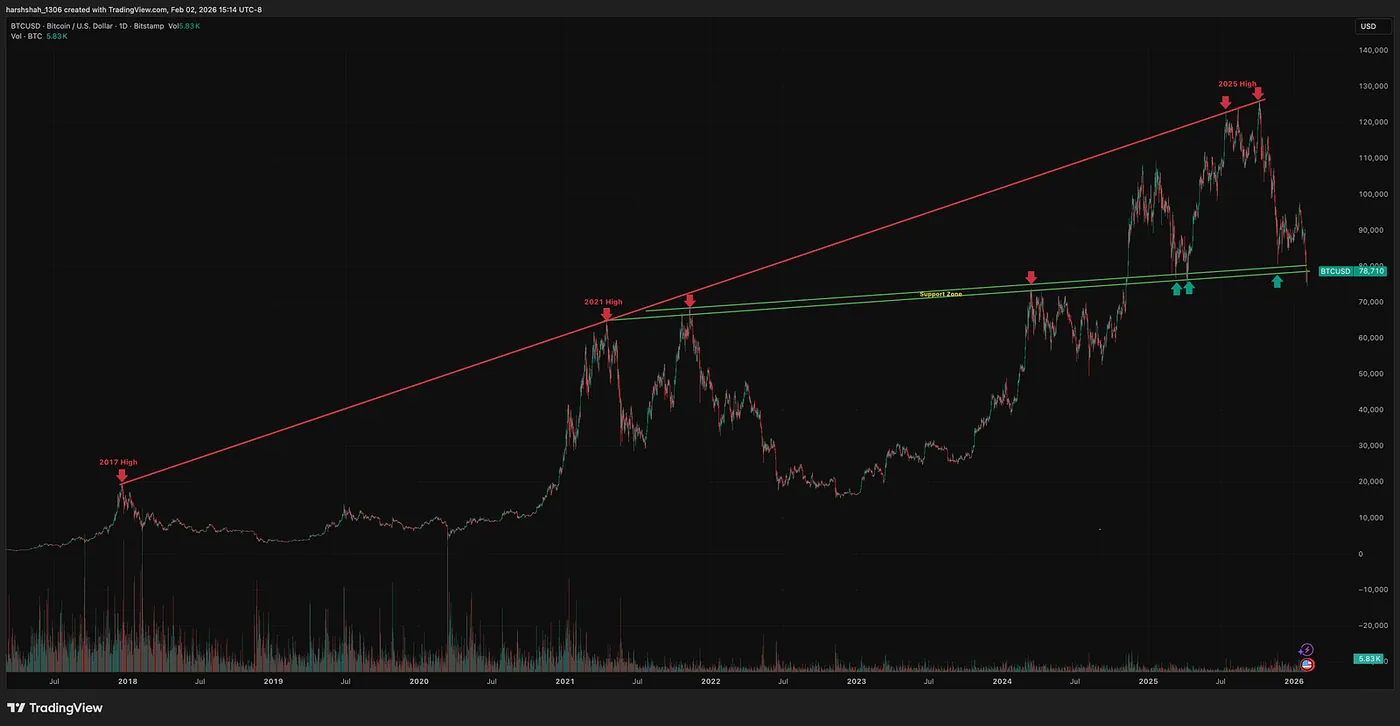
Now price has retraced back into a former resistance zone that has flipped into support — exactly how markets tend to behave ~75K.
From a pure structure standpoint:
👉 Yes, this is a strong support zone for a bounce.
So Why Am I Still Cautious?
Because context matters.
Despite price reaching support, the chart is also showing signs of a bearish head-and-shoulders pattern forming — especially when viewed alongside broader macro uncertainty.
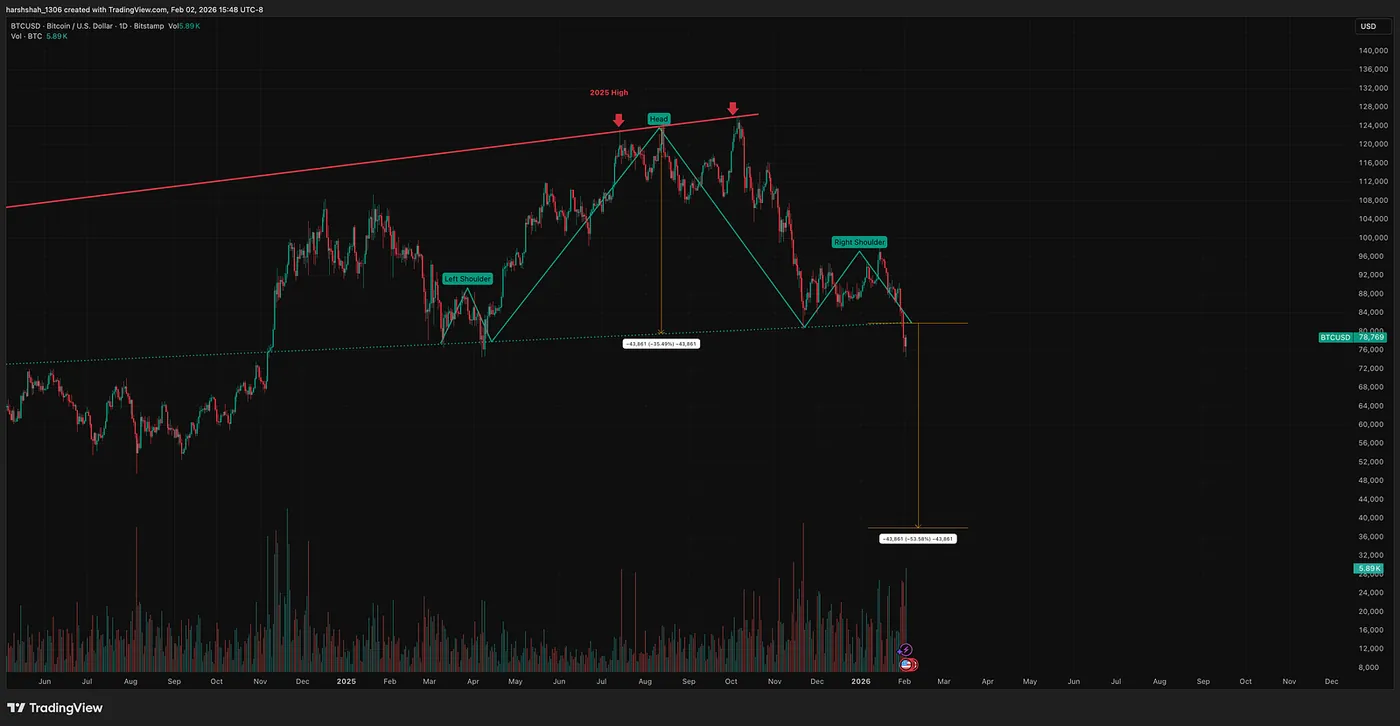
If this pattern fully plays out, the worst-case downside target sits near ~$37k.
Is that guaranteed?
Absolutely not.
But it is a risk I have to respect.
I’m not interested in picking cents in front of a steamroller, even if the support looks attractive.
What I’m Actually Doing Now
I’m waiting.
Specifically, I want to see:
- Price stabilize at this support
- Selling pressure slow down
- Evidence that buyers are defending the level
If support holds and price action improves, I’m open to entering BTC — or even MSTR.
If support breaks, I step aside. No arguments with the chart.
How Different Traders Should Think About This
- Long-term believers in Bitcoin:
This zone makes sense for gradual accumulation / DCA, as long as risk is managed. - Swing traders:
Be cautious. A clean breakdown below support should be respected, not rationalized.
Same chart.
Different time horizons.
Different decisions.
Final Thoughts
This is exactly why technical analysis matters.
Not because it predicts the future —
but because it helps you manage uncertainty.
Bitcoin is at a level where:
- A bounce is possible
- A breakdown is dangerous
- Patience is required
The market doesn’t pay you for being early.
It pays you for being right — with risk controlled.
For now, this is a make-it-or-break-it zone.
And the smartest move here isn’t action —
it’s observation.
If you find my blogs helpful and learnt something new about investing, consider following me on Medium to get notified when I publish new articles.