Understanding the Head & Shoulders Pattern
How to Spot It, Trade It, and Set a Target
By Harsh Shah · Updated
The head and shoulders is a bearish reversal chart pattern. It has three peaks: a higher middle peak (the head) between two lower peaks (the shoulders), all resting on a common support line called the neckline. When price breaks below the neckline, it signals that the uptrend has likely ended and sellers have taken control.
Disclaimer: This information is for educational purposes only and should not be considered financial advice.
Why I Trust This Pattern
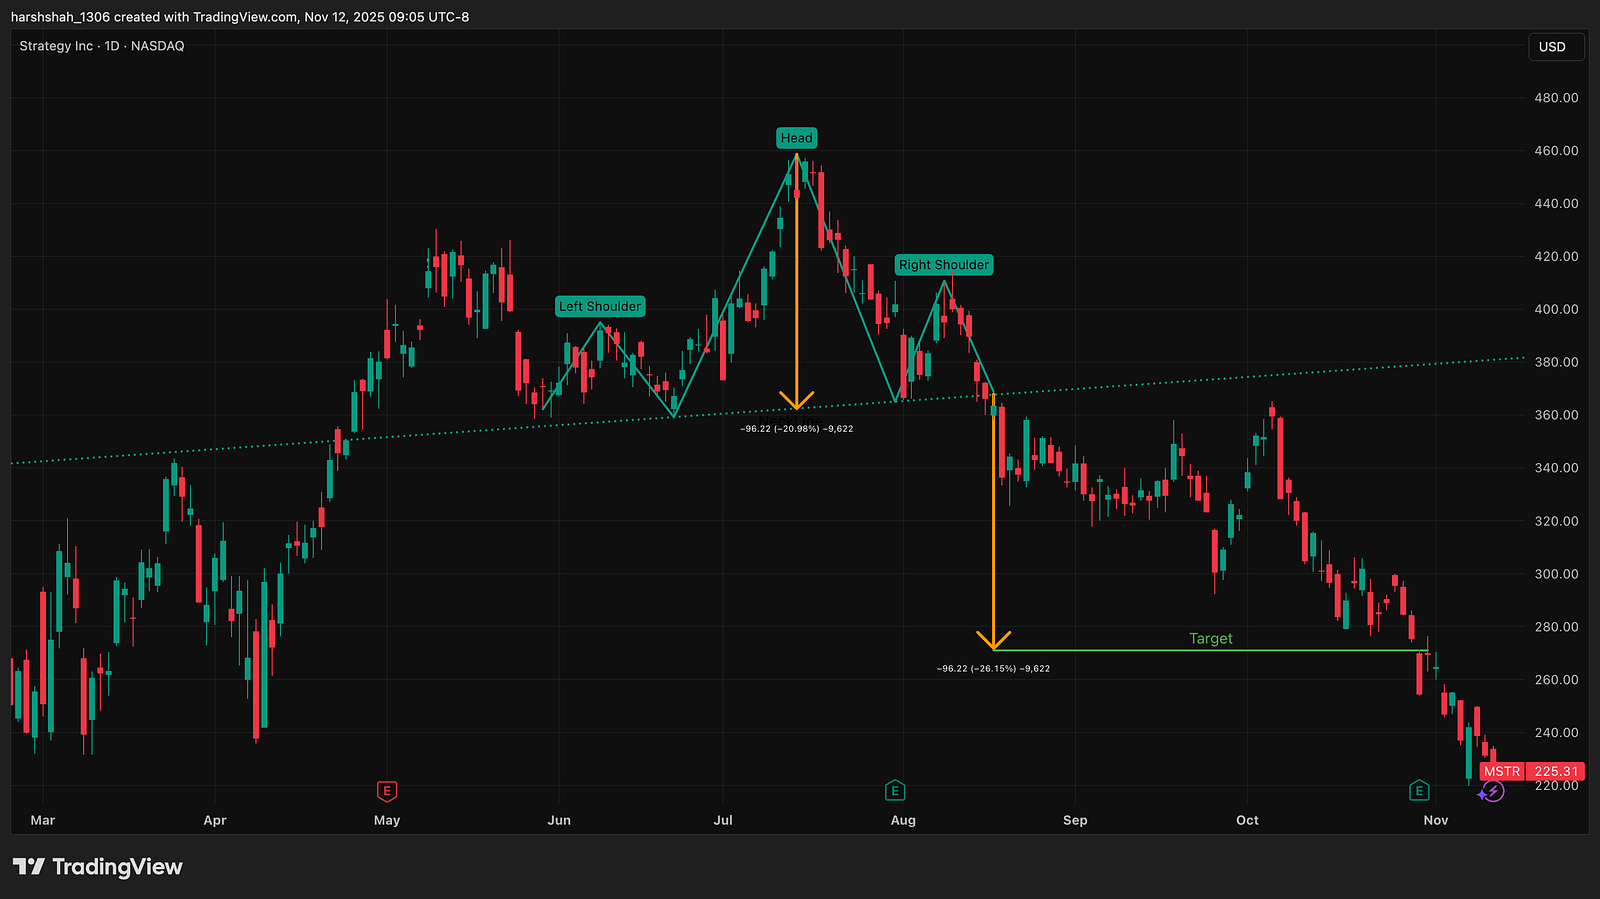
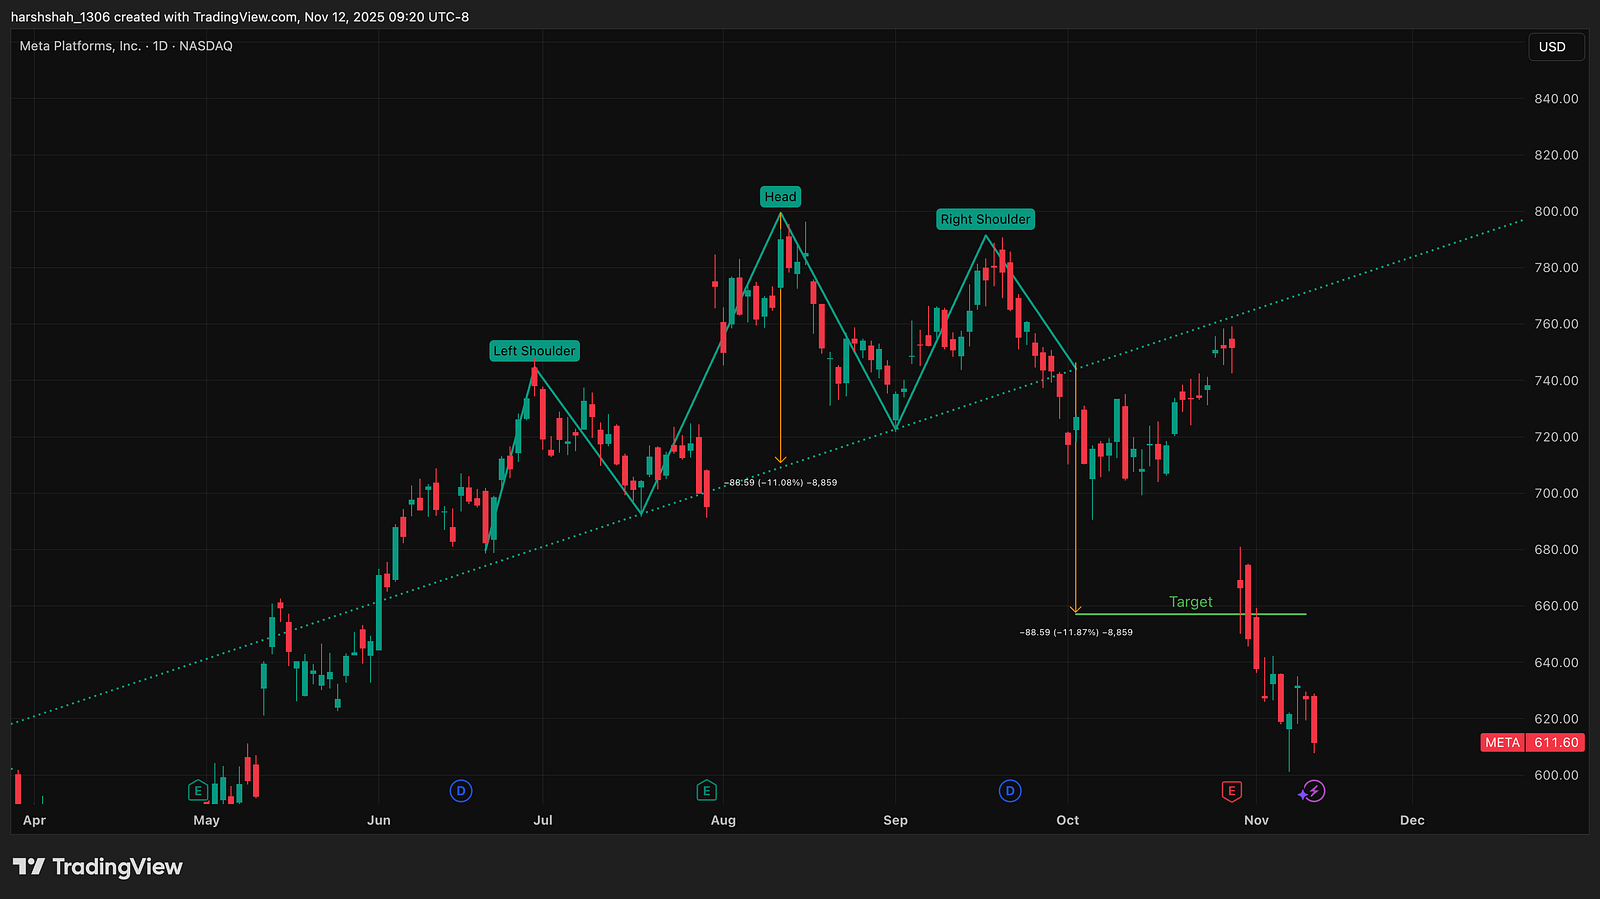
On October 3, 2025, I flagged this exact pattern on MSTR (MicroStrategy) and META (Meta) as a strong bearish signal, with a price target. I'm not sharing it to boast about the call. Spotting the pattern early is what stopped me from FOMO-buying both stocks.
Checking back in, the analysis played out:
- MSTR: fell 26% in just under a month.
- META: the same pattern preceded an 11% drop.
The pattern gave two clear paths to value:
- For traders: a clear signal for a short position or a put option, a potential 26% gain on MSTR and 11% on META.
- For investors: a critical “wait and see” signal. Heeding it meant saving 26% (MSTR) or 11% (META) by not buying at a technical top. Every dollar saved is a dollar made.
That's disciplined technical analysis protecting capital. Here's the pattern in detail, so you can spot the next one yourself.
What Is the Head and Shoulders Pattern?
The head and shoulders is one of the most classic bearish chart patterns in trading. It signals that an uptrend is losing steam and sellers are taking control. (An uptrend is a series of consistently higher highs and higher lows.)
What It Looks Like
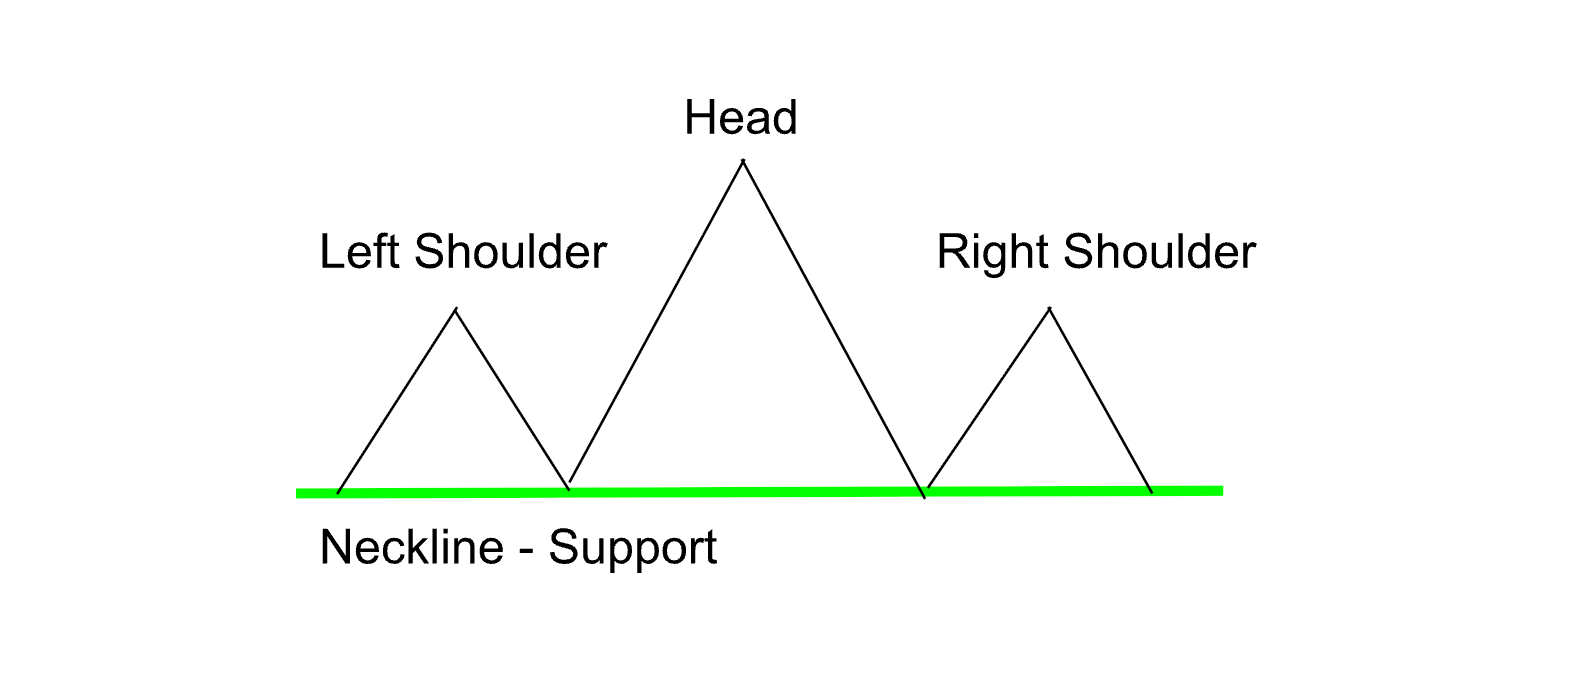
- Left shoulder: price rallies, then dips slightly.
- Head: price rallies again, this time to a higher high, then pulls back.
- Right shoulder: price rallies once more but fails to reach the height of the head. Sellers step in earlier.
Along the bottom of the pattern is the neckline, which acts as support. Once price breaks below it and the break is confirmed, the trend has officially turned bearish.
Why Is It Called Head and Shoulders?
The pattern looks like a person's head and shoulders:
- A high peak (the head)
- Flanked by two smaller peaks (the shoulders)
This version is right side up. Flip it upside down and you get its bullish twin, the inverse head and shoulders.
The Psychology Behind the Pattern
Why does it work? It's all about shifts in confidence.
- Left shoulder: bulls are confident and push price up. Sellers take minor profits.
- Head: bulls make one last big push to a higher high. Optimism is at its peak.
- Right shoulder: price rises again, but with less conviction. Smart money is selling.
- Neckline break: once price falls below support, panic sets in. Bulls capitulate and sellers take over.
Put simply: buyers get weaker, sellers get stronger, and the breakdown confirms the momentum shift.
3 Rules for Identifying a Head and Shoulders
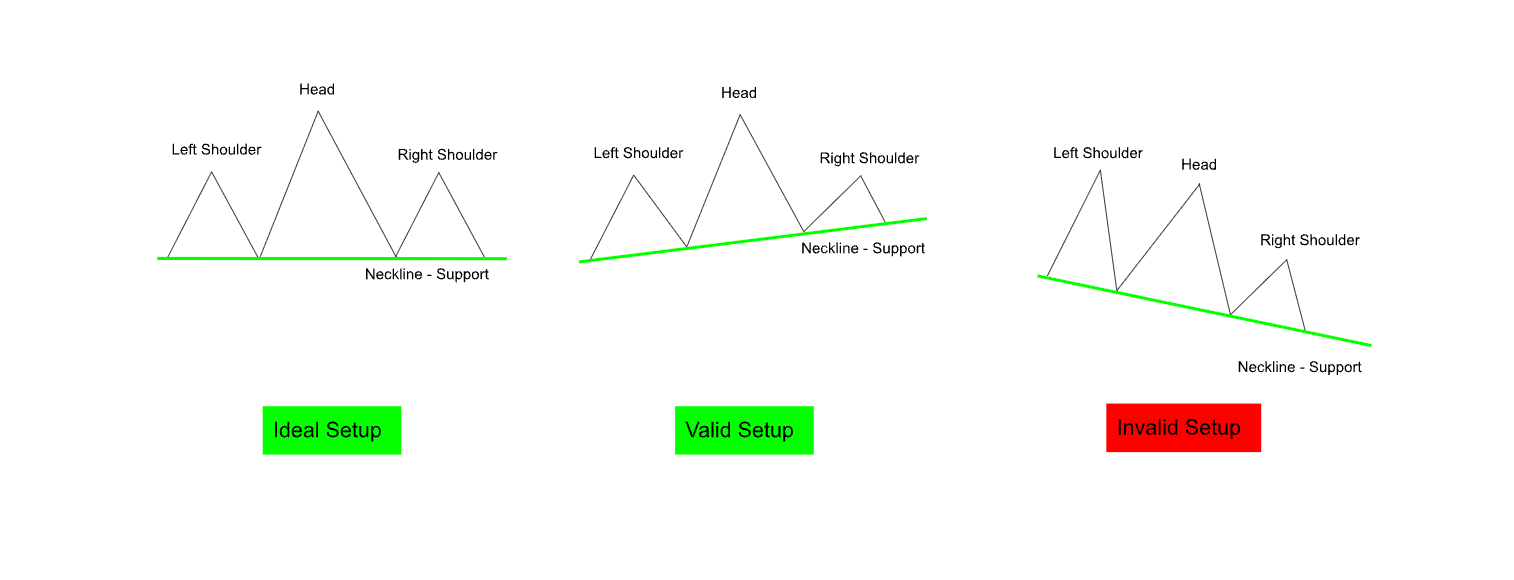
1. Symmetry
The pattern should look balanced. A lopsided formation reduces its reliability.
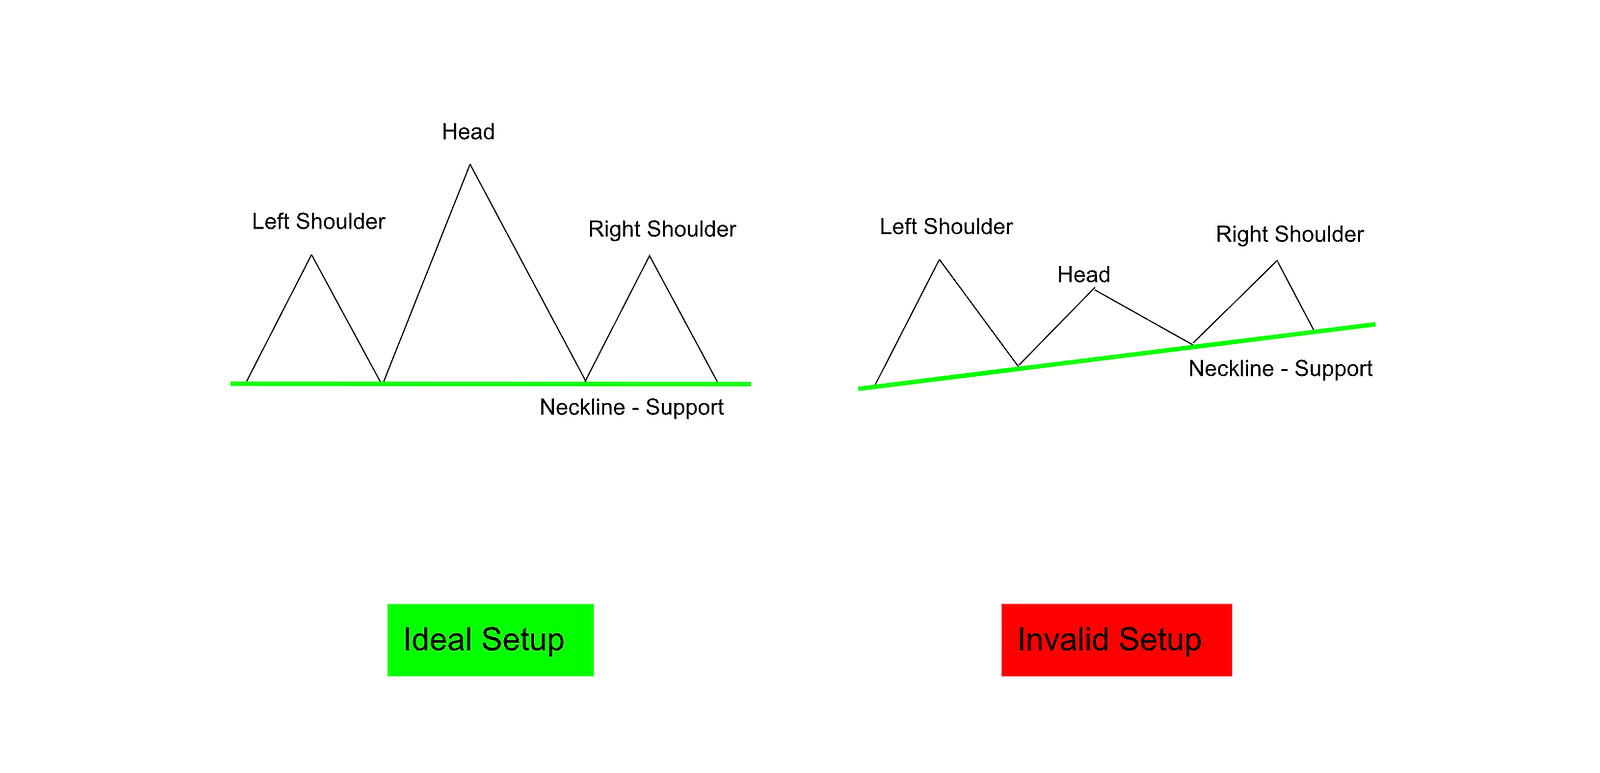
2. The Head Must Be the Tallest Peak
The central peak (the head) must be clearly higher than both shoulders.
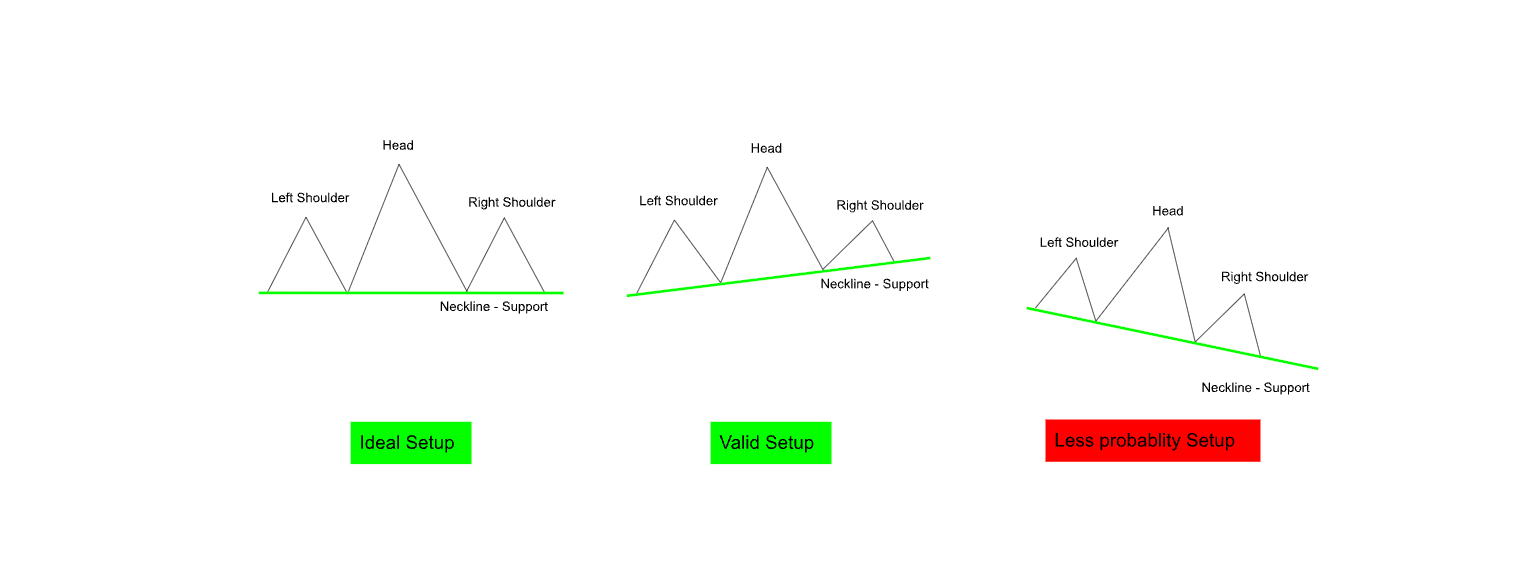
3. Neckline Angle
A flat or slightly upward-sloping neckline is best (0° to 45°). Avoid steep downward slopes. They weaken the setup.
How to Calculate the Head and Shoulders Price Target
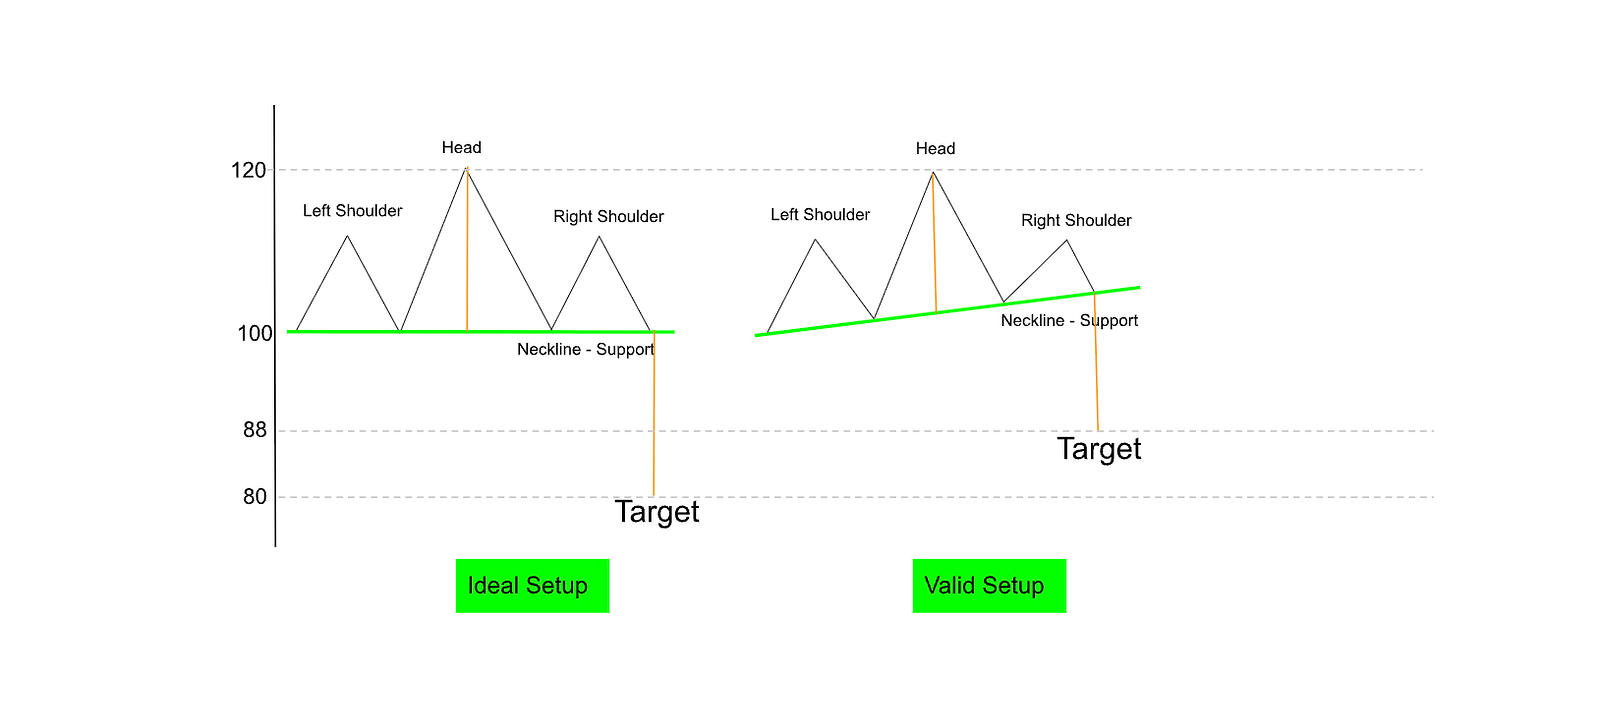
- Measure the height: the vertical distance from the top of the head to the neckline (support).
- Project it down: subtract that same distance from the point where price breaks the neckline.
- That's your target: the projected level is the profit target.
In the ideal setup above, the head peaks at 120 and the neckline sits at 100, a 20-point height. Projected down from the break at 100, that gives a target of 80. With a rising neckline (the valid setup on the right), you measure from the head straight down to the neckline and project from wherever price actually breaks it.
How to Trade It
The head and shoulders is useful because it gives you a complete plan:
- A clear momentum shift: from uptrend to downtrend.
- An entry: short below the neckline.
- Risk management: the stop loss usually goes above the right shoulder, or on any confirmed close back above the neckline.
- A profit target: the head-to-neckline distance often projects the next move.
When the Pattern Is Strongest
- Location: most powerful after a strong uptrend, at market tops.
- Timeframe: longer timeframes give stronger signals. Monthly beats weekly beats daily.
- Confirmation: always wait for a neckline break, ideally on rising volume.
- Retest entry (“scene of the crime”): the ideal entry is on a retest of the neckline after the breakdown. If it doesn't retest, you can still enter, but the risk/reward may be lower.
Real Example: MSTR's 26% Drop
After the neckline break was confirmed, MSTR came back almost to the “scene of the crime” before starting a steady flush lower. It hit the target with a 26% drop and kept sliding. Recognizing the pattern early kept me out of FOMO and spared me that entire drawdown.
Real Example: META's 11% Drop
A similar pattern showed up in Meta. Again, I avoided FOMO and it paid off: staying disciplined meant sidestepping a clean 11% drop.
Want another one? See how the same pattern set up a potential 67% downside in OKLO.
Final Thoughts
The head and shoulders is more than a shape. It's a story of confidence fading: bulls push, each rally gets weaker, and finally sellers take full control. That's why it's one of the most respected bearish reversal patterns.
Learn to spot it and you'll recognize when optimism is peaking, giving you the chance to short near the top or step aside before the fall.