MDB — The 45% Drop That the Charts Warned About
By Harsh Shah · Updated
Disclaimer: This content is for educational purposes only and should not be considered financial advice.
Technical Analysis never stops amazing me.
Price action speaks in real time.
It updates every second.
And if you listen carefully, it tells you when to act — and more importantly — when not to.
Over the past decade, I’ve built a system around structure and momentum.
And time and again, it has helped me step aside before the crowd realizes what’s happening.
When MDB was trading near $445, I knew something wasn’t right.
The signs were bearish.
Fast forward 4 months…
The stock is now trading around $250.
That’s a ~45% drop.
Avoiding a 45% drawdown is just as powerful as catching a 45% rally.
Let me show you how the chart told the story.
📚 Before We Dive In
To understand this setup properly, review:
These concepts form the foundation of this breakdown.
December 19th, 2025 — The Warning Sign
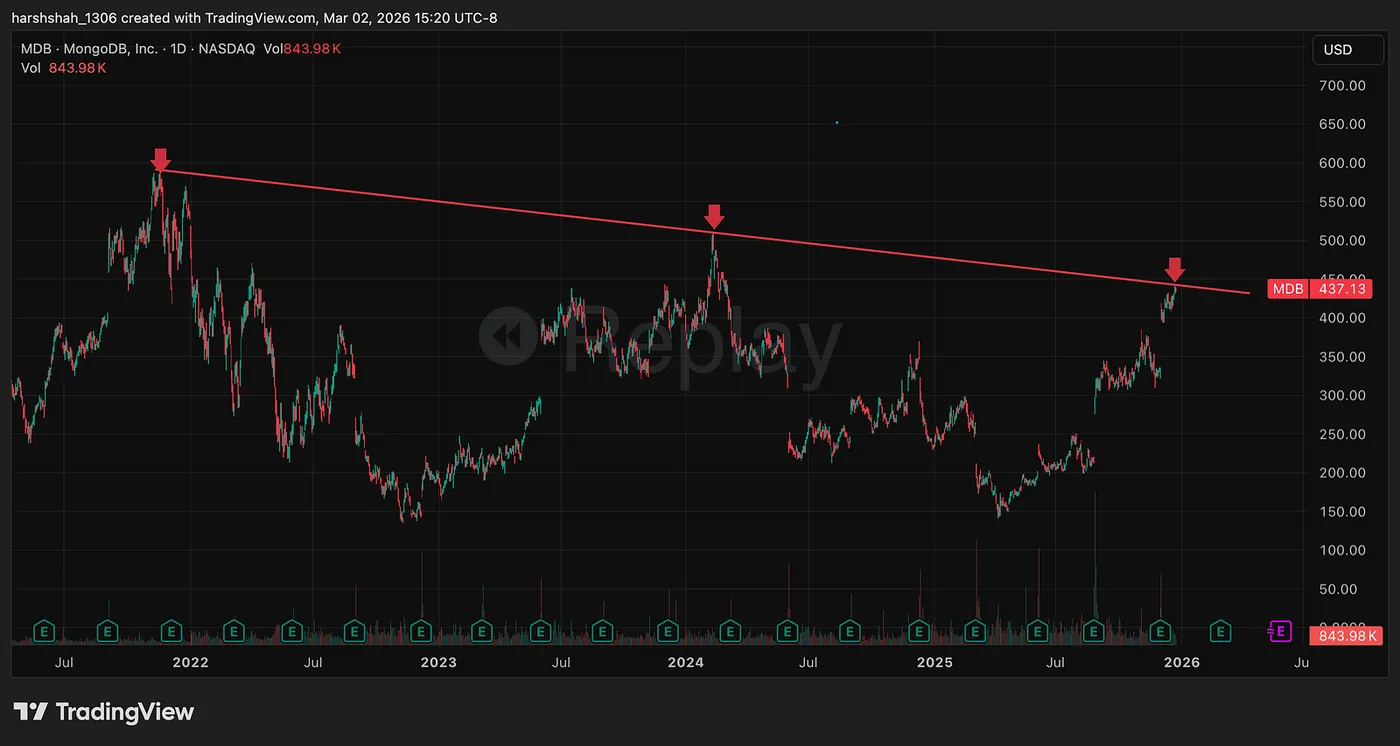
MDB was trading right at a major trendline resistance — a line stretching back to 2022.
Everyone was bullish.
But the chart wasn’t.
When price presses into multi-year resistance, probabilities shift.
At that level, I had two logical choices:
1️⃣ Take profits
2️⃣ Wait for confirmation
What I would never do?
Buy aggressively into resistance.
Soon after, price began pulling back.
Early March— The Setup Forms
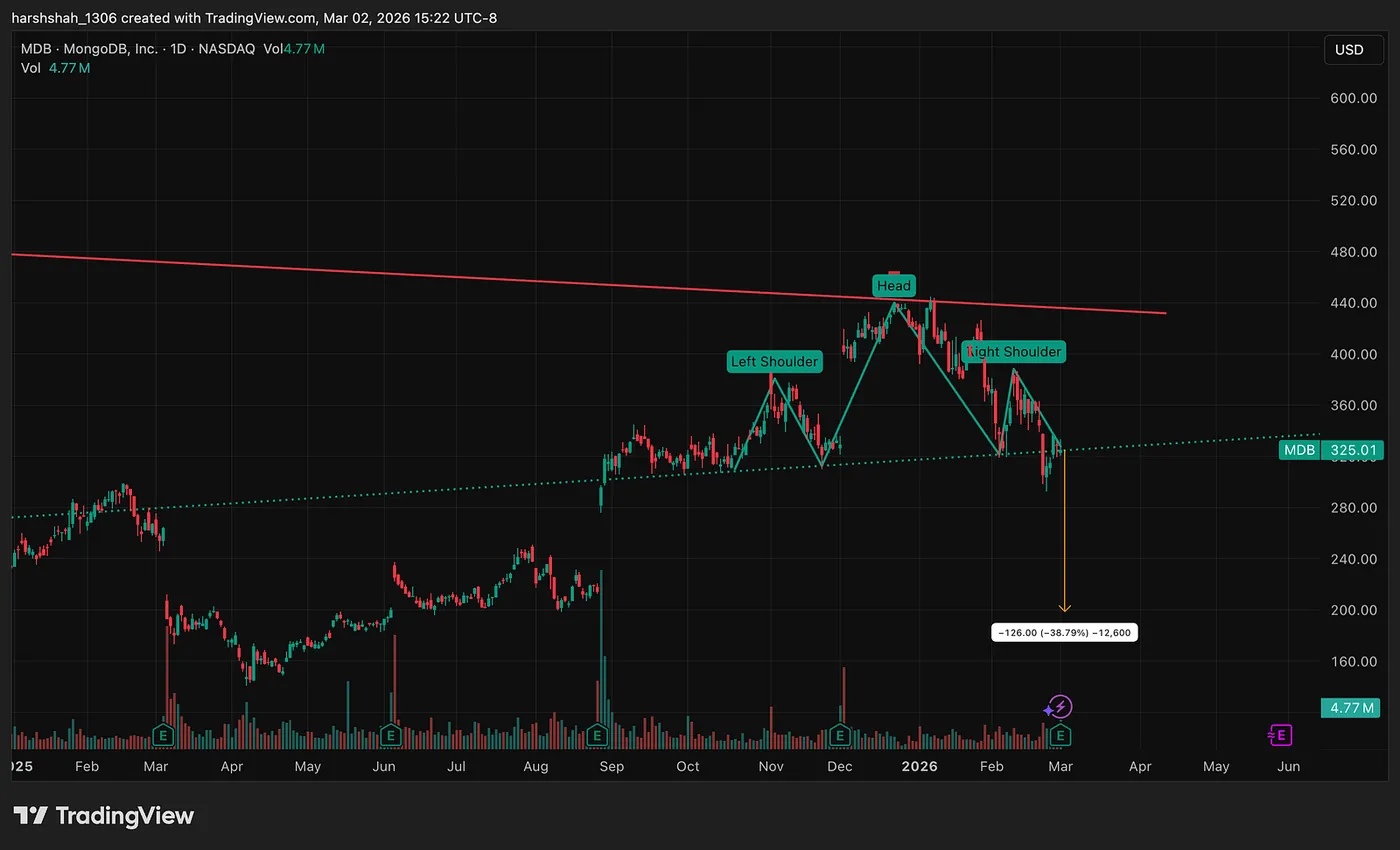
By early March, MDB had already dropped to around $325 — roughly a 20% correction from its highs.
But something more important was forming.
A Head & Shoulders pattern.
One of the clearest bearish reversal structures in technical analysis.
And the projected target?
Around $200.
That wasn’t prediction.
That was structure.
Today — The Full Picture
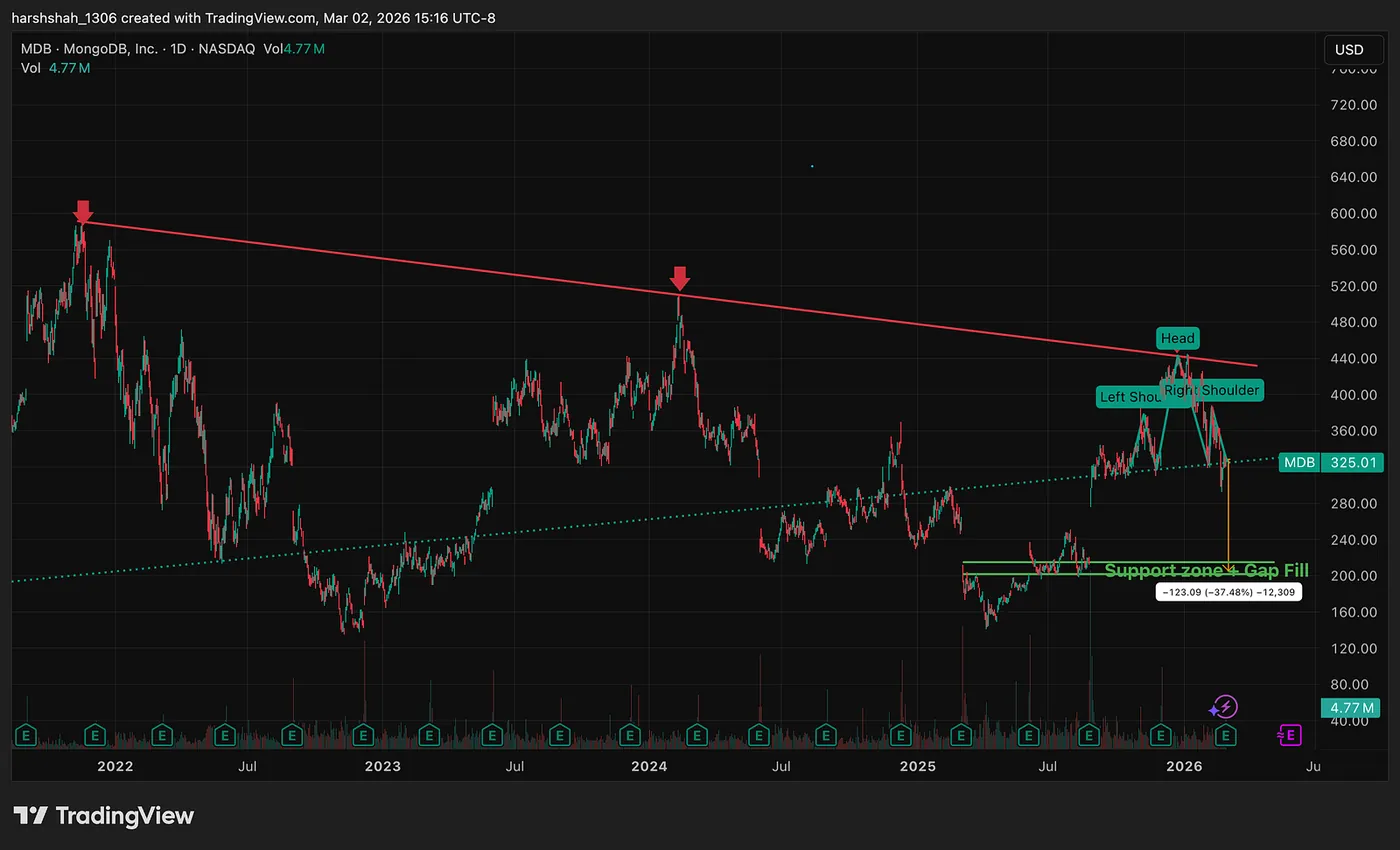
Post earnings, MDB is now around $250.
That’s:
- ~45% down from ATH
- ~25% down since the H&S setup around earnings
And now?
Price is heading toward the next logical area:
👉 $200–210 zone
Why that level?
Because it aligns with:
- A prior gap fill
- Major horizontal support
- Structural demand
That’s where probabilities begin to shift again.
So what am I doing?
Waiting.
🧠 The Real Lesson
Technical analysis isn’t about predicting.
It’s about positioning.
The trendline warned.
The H&S confirmed.
Momentum followed.
Multiple data points aligned.
When structure and momentum agree, you listen.
Avoiding the 45% drop wasn’t luck.
It was process.
Final Thoughts
This is why I love technical analysis.
It removes emotion.
It replaces noise with structure.
It gives you a roadmap.
Does it always work?
No.
Nothing does.
But when multiple factors align — resistance, pattern, momentum — probabilities tilt.
Right now, MDB is approaching a key support zone.
If structure shifts again, we reassess.
That’s the game.
Not prediction.
Not ego.
Just probabilities.
🎓 Want to Learn How I Think About Charts?
Over the past decade, I’ve refined a structured framework for reading price action — not predicting, but reacting with probabilities.
In my upcoming Technical Analysis course, I break down:
- How I identify major resistance before the crowd
- How patterns like Head & Shoulders actually work in real markets
- How I combine structure + momentum
- How to avoid large drawdowns
- Risk management & journaling
- Step-by-step trade planning
If you want to build a repeatable process instead of guessing, you can join the early access list here:
👉 datadriveninvesting.io/course