The Trading & Investing Framework: Mean Reversion Trading — Part 8
By Harsh Shah · Updated
Disclaimer: This article is for educational purposes only and should not be considered financial advice.
In the previous part, we covered pattern breakouts — how markets transition from compression to expansion.
Now we move into the other side of the equation:
Mean Reversion.
This is where markets go too far…
And snap back.
Master the markets through a structured, free roadmap that transforms technical complexity into a clear, actionable path for beginners.
🔥 The Core Idea: Markets Stretch — Then Rebalance
Markets don’t move in straight lines.
They expand…
Then contract.
Trend → Overextension → Pullback → Repeat
Most traders chase moves after they’ve already stretched.
Mean reversion traders focus on:
👉 Price that has gone too far, too fast
Because that’s where probability shifts.
🧠 Think Like This: Price is a Rubber Band
Imagine pulling a rubber band away from your hand.
The further it stretches…
The stronger the snap back.
That’s exactly how price behaves.
When a stock moves far away from its average:
- Emotions take over (FOMO / panic)
- Price becomes inefficient
- Reversion becomes likely
Your job is simple:
Identify the stretch → Wait for exhaustion → Trade the snap back
📊 Where Mean Reversion Opportunities Come From
Overextended Moves (Parabolic Runs)
Sharp vertical moves in short time. Often followed by sharp pullbacks
What it tells you: Buyers are exhausted.
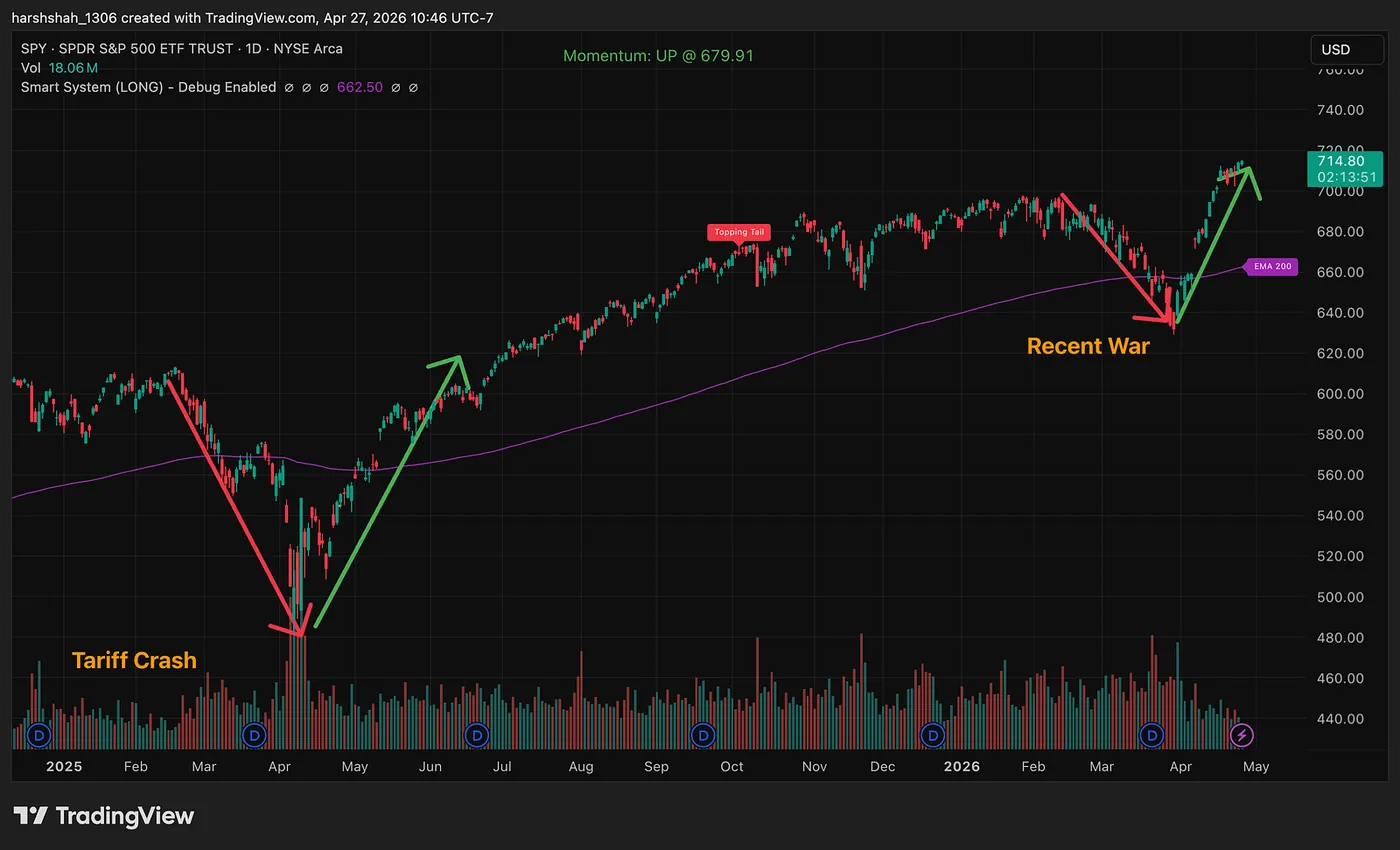
Example:Historical price action in the SPY suggests that deep, ‘rubber-band’ extensions to the downside lead to high-velocity mean reversions. Much like the 2020 pandemic correction, recent war, the steepness of the decline served as a catalyst for a swift V-shaped reversal.
Deviation from Moving Averages
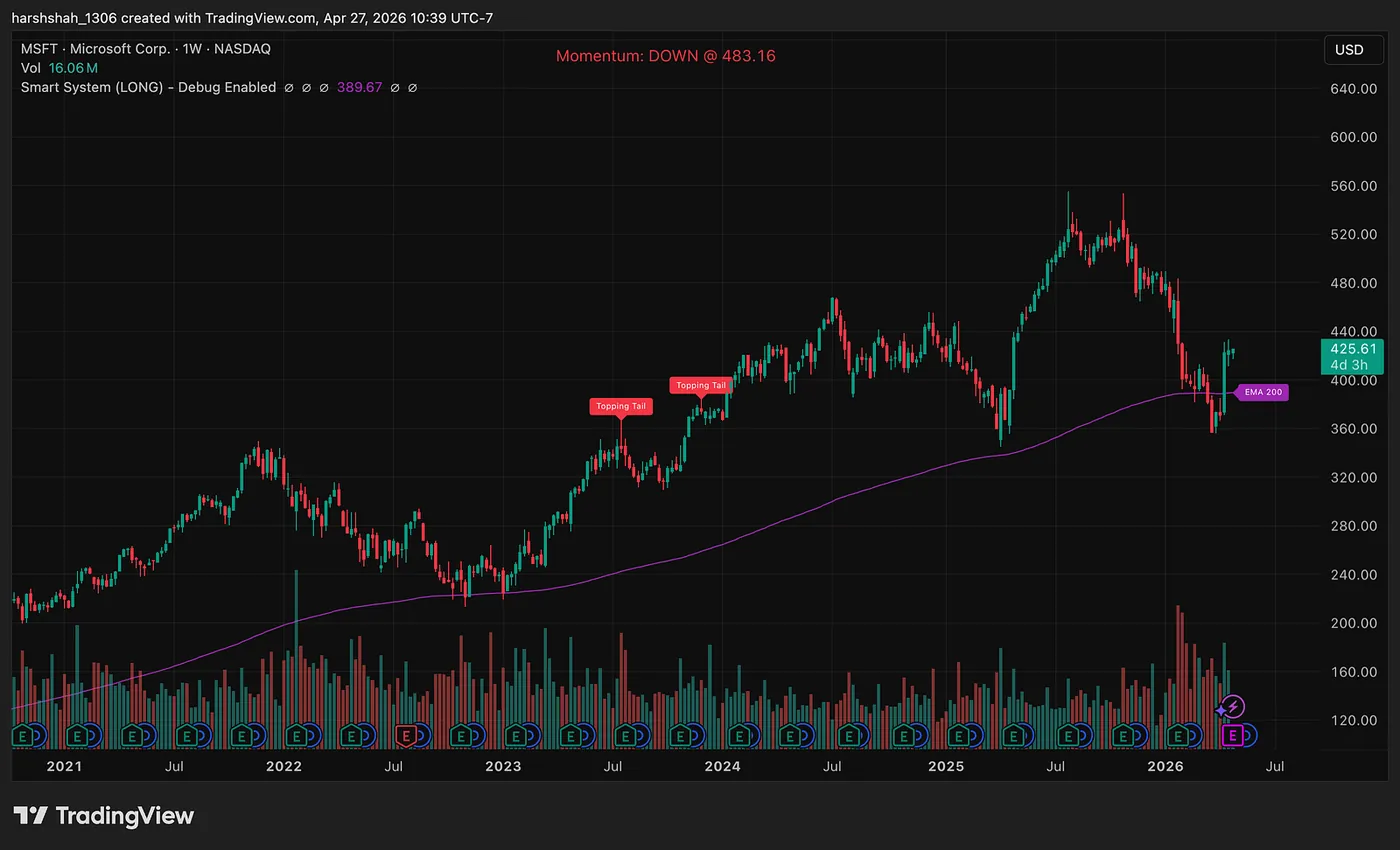
Price moves far from key averages (50 EMA, 100 EMA, 200EMA), eventually, they revert toward the mean
What it tells you: Price is out of equilibrium.
Example:Microsoft exhibits a strong mean-reversion habit; whenever it overextends from the 200-week EMA, it eventually pulls back to find support there.
Other Setups that often work w/ mean reversion:
- Double Top: This formation highlights buyer exhaustion at a specific peak. When the price fails to clear its previous high, it confirms the asset is overstretched, often sparking a reversal back down to the average.
- Double Bottom: This setup identifies a structural floor where selling pressure has dried up. It suggests the price has hit a “max stretch” to the downside and is now primed to bounce back toward its central mean.
- Support & Resistance: These levels serve as the historical boundaries of price action. When an asset hits these zones, the “rubber band” is at full tension, making a rejection and subsequent return to the baseline highly probable.
Key Distinctions: Mean Reversion vs. Momentum/Pattern Traders
- Mindset on Price: Mean reversion traders view price through the lens of equilibrium, believing that anything that stretches too far must return to its average, whereas momentum traders believe “the trend is your friend” and expect strength to lead to more strength.
- Entry Strategy: A mean reversion trader looks for exhaustion and overextension to “fade” the move; in contrast, pattern and momentum traders wait for breakouts and confirmation to join the move.
- Emotional Context: Mean reversion traders capitalize on market extremes (excessive fear or greed), while momentum traders capitalize on sustained enthusiasm and the continuation of a trend.
- Trade Objective: The goal for a mean reversion trader is to capture the snap-back to the mean, while momentum and pattern traders aim to capture the expansion into new territory.
🎯 Entry & Risk Management
This is where most traders get it wrong.
Mean reversion is not about guessing tops or bottoms.
It’s about timing exhaustion.
Entry Options:
- Aggressive → First sign of rejection (wicks, reversal candle)
- Conservative → Confirmation (structure break on lower timeframe)
Stop Loss: Beyond the extreme (invalidation of the move)
Target:
- Return to mean (moving average)
- Mid-range levels
- Previous support/resistance
⚠️ Common Mistakes
Most traders lose money in mean reversion because they:
- Try to catch falling knives
- Short strong trends too early
- Ignore momentum
- Trade against higher timeframe trend
- Don’t wait for confirmation
- Don’t use a STOP Loss
Mean reversion works best when the move is exhausted… not just extended.
🚀 How to Get Started
Keep it simple:
- Mark key moving averages
- Identify stocks far from their mean
- Wait for clear exhaustion signals
- Focus on 2–3 setups only
- Backtest 50–100 trades
- Track what works
Over time, something shifts:
You stop reacting to price…
And start understanding it.
🔍 What’s Coming in Part 9
Scanning charts manually isn’t scalable.
In this section, you’ll learn how to:
- Create screeners based on your strategy
- Filter high-probability setups
- Use simple automation to save time
- Build a repeatable workflow
The goal:
👉 From random chart browsing → to a system that finds setups for you.
🚀 Final Thought
Mean reversion trading is simple — but deceptive.
It requires:
- Patience (waiting for extremes)
- Discipline (not forcing entries)
- Awareness (reading exhaustion correctly)
The market punishes those who chase…
And rewards those who wait for imbalance.
You’re not predicting reversals.
You’re positioning for rebalancing.