Understanding the Double Top Pattern
This stock surged 220% in 160 days — A reversal on the horizon!
By Harsh Shah · Updated
Disclaimer:This information is for educational purposes only and should not be considered financial advice.

Every surge has its limit.
The momentum that fuels a rally will eventually run out, and the key is to wait for the right setup.
With Technical analysis, spotting these reversals isn’t complicated — it’s about understanding the psychology of the market.
Imagine buying a stock at $228, only to watch it crash.
For five agonizing years, you were underwater. Every time you checked your portfolio, you saw that heavy, red number.
You waited, you hoped, and you prayed for one thing: to get your money back.
When the price finally crawls back up to your original entry — $228 — what’s the first thing you think? “Thank goodness! I’m finally getting out.”
If you’re like most investors, you immediately hit the sell button.
Why “Getting Even” Creates a Market Ceiling — The Double Top
When a stock finally climbs back to a price where thousands of people first bought it years ago, those investors have one goal: escape.
This massive, collective sigh of relief turns into an overwhelming selling pressure right at that price. It’s not the price the market resists; it’s the flood of emotional selling.
This powerful selling zone forms a resistance level. When the stock hits this point and turns back, it creates the classic bearish signal: the Double Top pattern.
- Peak 1: The original high where people first bought.
- Peak 2: The “mass psychological exit” where trapped investors finally sell to break even.
For smart traders, this is a clear signal.
When the Double Top is confirmed by other indicators like RSI or volume divergence, it tells you the emotionally-relieved sellers have taken control, making a significant price drop highly probable.
How do I trade Double Top ?
- Long term investments — Caution to Dollar Cost Average (DCA) or buying at the inflated prices.
- Trading — Short at the double top w/ any confirmation above as a stop loss.
In technical analysis, certainty doesn’t exist — only probability. To gain an edge, you must wait for the price to not only break above a key resistance level but to confirm the move with multiple supporting factors.
Let’s explore some real-world case studies of the Double Top Bearish Pattern.
SOFI (Daily Chart) — A two Factor Setup
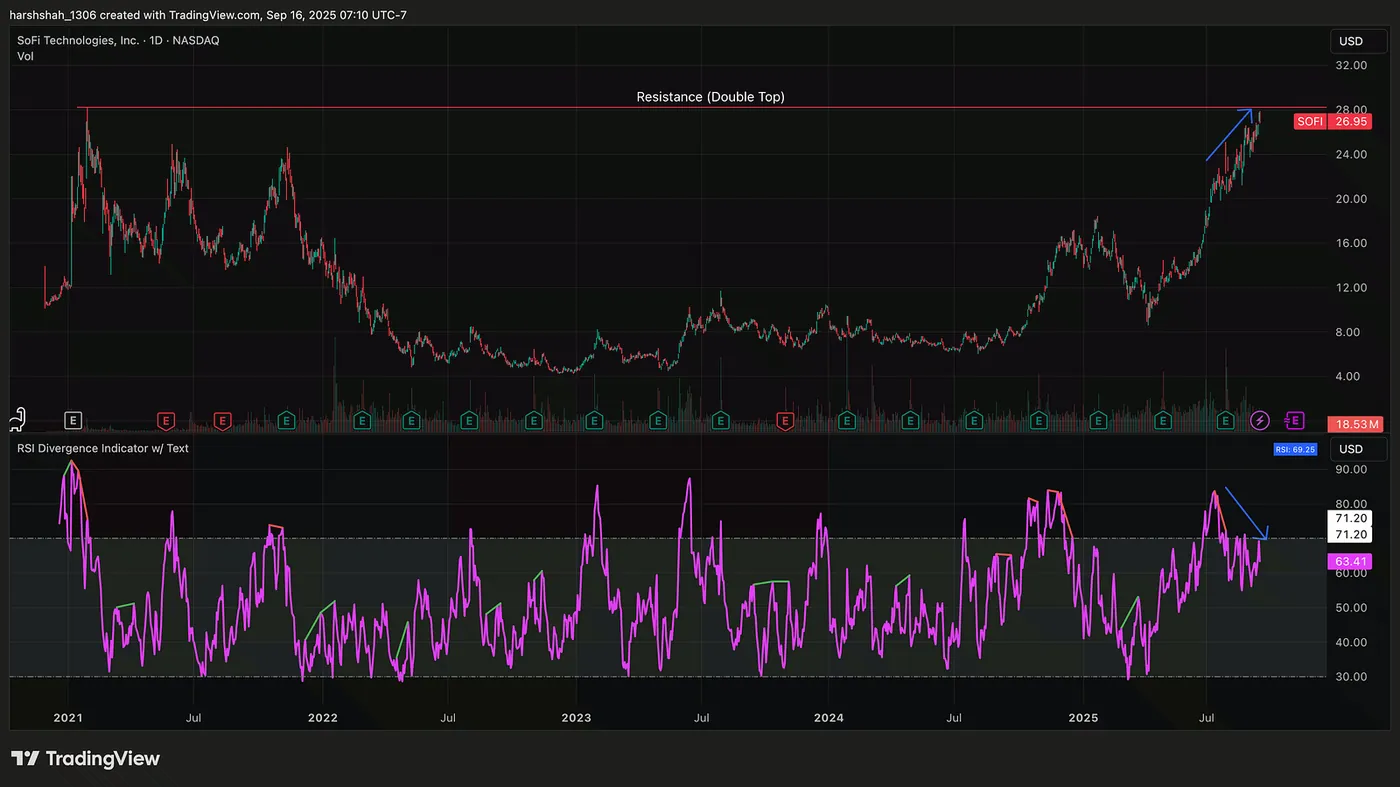
SOFI has surged over 220% since April 7th.
It is approaching its previous high of around $27-$28 from 2021, creating a “double top” chart pattern.
Additionally, a significant RSI divergence suggests that momentum is weakening even as the price rises.
This combination could indicate a potential price pullback. We’ll have to wait and see if the stock faces resistance at this key level.
GE (Weekly Chart) — A two Factor Setup
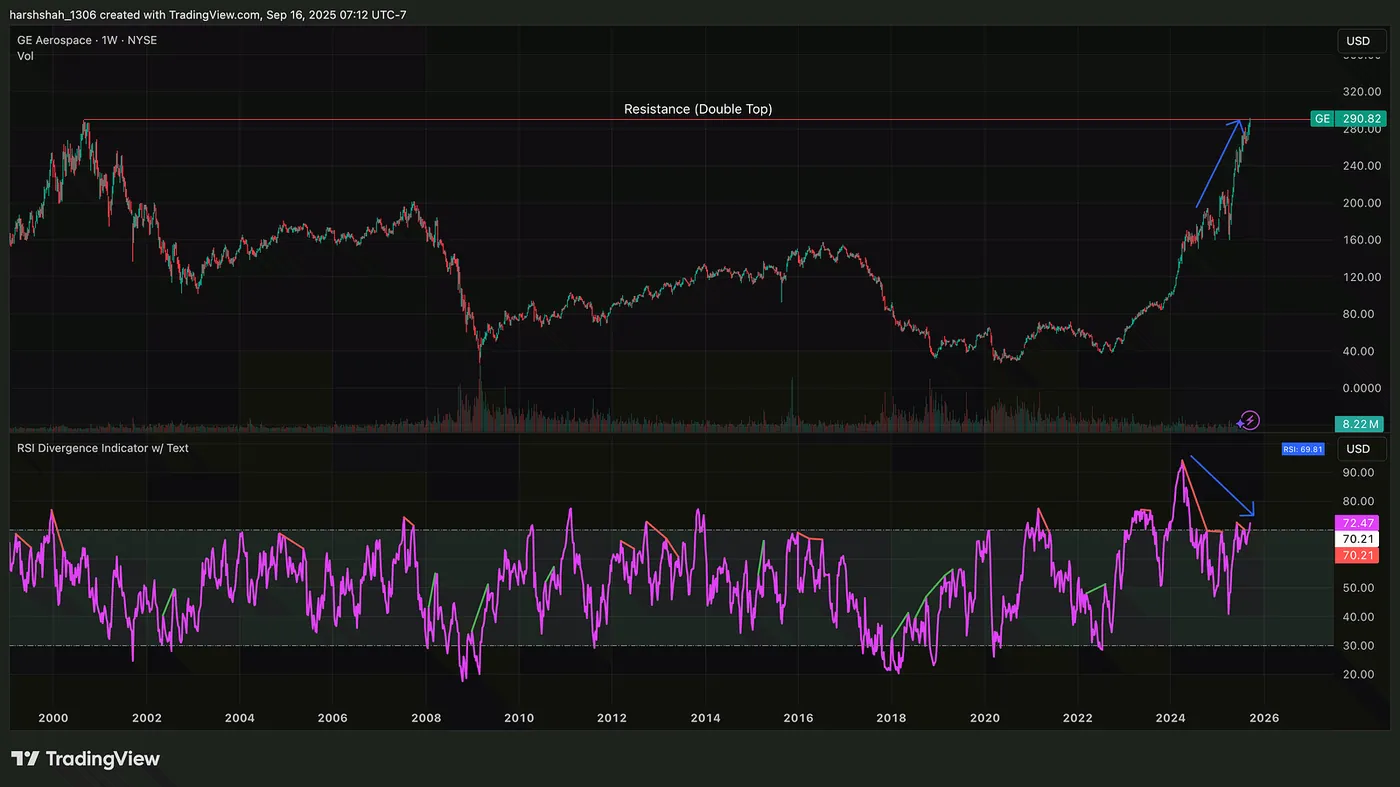
GE stock is nearing the peak it reached in 2000, which could create significant selling pressure as long-term investors who have been holding for 25 years look to sell at their break-even point.
This potential resistance is compounded by a significantRSI divergence, a technical signal that suggests the current rally may be losing momentum.
Doordash — Daily Chart (Case Study)
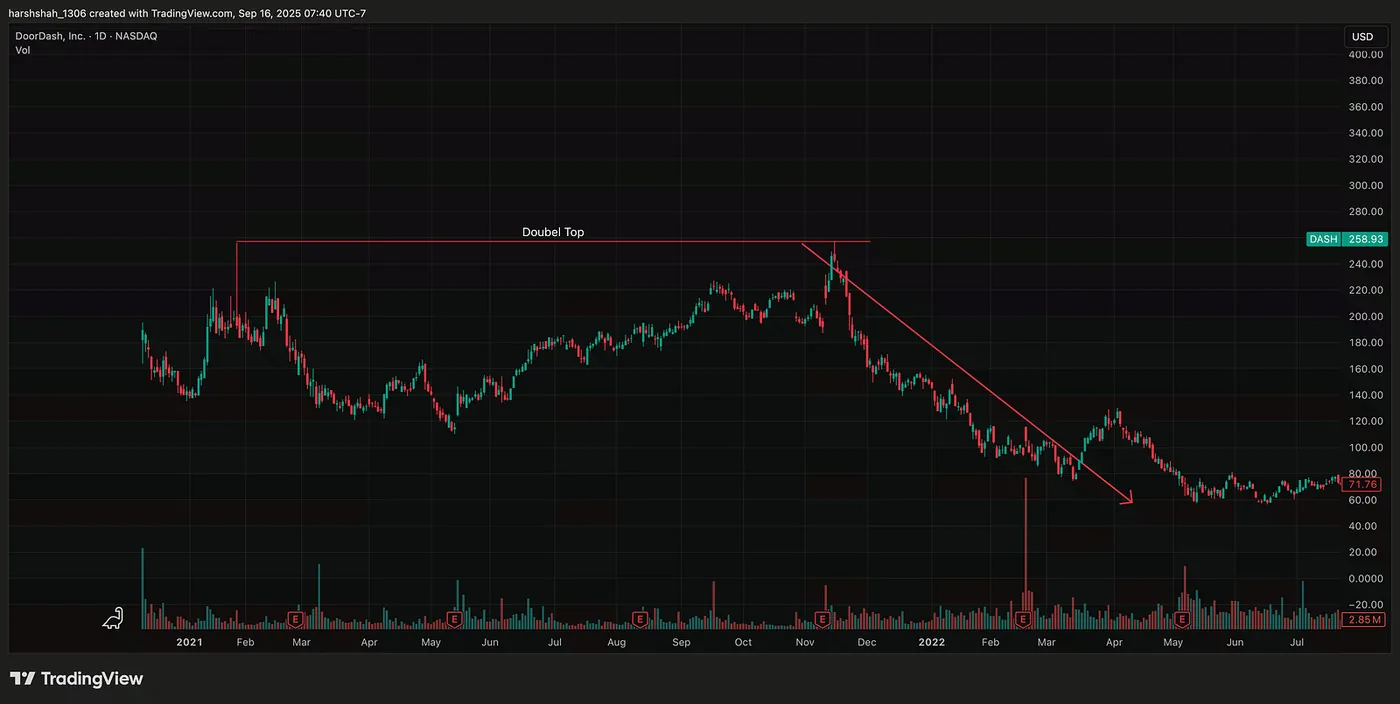
In 2021, the double top pattern on the DoorDash (DASH) chart proved to be a perfect reversal signal, with the stock crashing 70% after reaching its second peak.
Final Thoughts
The double top pattern isn’t just a technical signal; it’s a powerful display of market psychology. The emotional selling, combined with weakening momentum indicators like RSI divergence, creates a significant ceiling for the price.
Ultimately, a stock’s past price isn’t just a number — it’s a checkpoint of human emotion. Understanding this can give traders a crucial edge in predicting future market moves.