Understanding the Double Bottom Pattern
DUOL, ENPH, and SNPS Setting Up for a Reversal — Understanding Psychology Behind the Double Bottom
By Harsh Shah · Updated
Disclaimer: This information is for educational purposes only and should not be considered financial advice.
Every drop has a floor.
The selling that drags a stock down eventually meets a point where sellers dry up and buyers step in — but the smart part is waiting for the right setup.
With technical analysis, spotting bullish reversals like the Double Bottom isn’t complicated. It’s mostly about reading the market’s psychology.
Understanding Double Bottom
Imagine you buy a stock at $50 and it drops hard.
After a while, the price hits a low 40$ and bounces. Later, it falls again to about the same low 40$ — but doesn’t break lower.
Buyers step in both times, showing strong support.
When the price finally moves above the middle peak (the resistance between the two lows), it’s a sign the downtrend is over.
A downtrend is the consistent downward movement of a stock’s price over a period of time, marked by a series of lower peaks and lower troughs.
That’s the Double Bottom — a bullish pattern that signals sellers are done, and buyers are taking control.
Why Double Bottoms Work (Psychology)
- First bottom = panic sellers exhausted, bargain hunters step in.
- Rally to the neckline = some profit-taking; others still nervous.
- Second test = sellers attempt to push lower but lack participation; longs defend the level.
- Breakout above neckline = trapped sellers have been shaken out earlier, new buyers and momentum enter, flipping psychology from bearish to bullish.
In short: the market tried to make a new low twice and failed. That failure attracts buyers and momentum.
How to Trade the Double Bottom Pattern
For Long-Term Investors:
Instead of going all in at the first sign of strength, consider gradually accumulating (DCA) while the base is forming. This helps smooth out entry prices and reduces timing risk.
For Traders:
Aggressive Approach: Enter near the second bottom as the pattern begins to take shape.
Stop Loss: Any confirmed close below the support or double bottom zone.
Patient Approach: Wait for confirmation — a clean breakout above the neckline with improving sentiment.
Stop Loss: Any confirmed close back below the neckline.
Tip: Your odds of success increase significantly when the breakout is supported by rising volume or clear bullish momentum.
Use Indicators to Improve Probability
- Volume: Look for rising volume on the breakout — it shows genuine buyer interest.
- Relative Strength Index(RSI): Positive divergence (higher lows on RSI while price makes similar lows) supports the pattern. A rising RSI through neutral levels on breakout adds conviction.
Lets take a look at some real world examples:
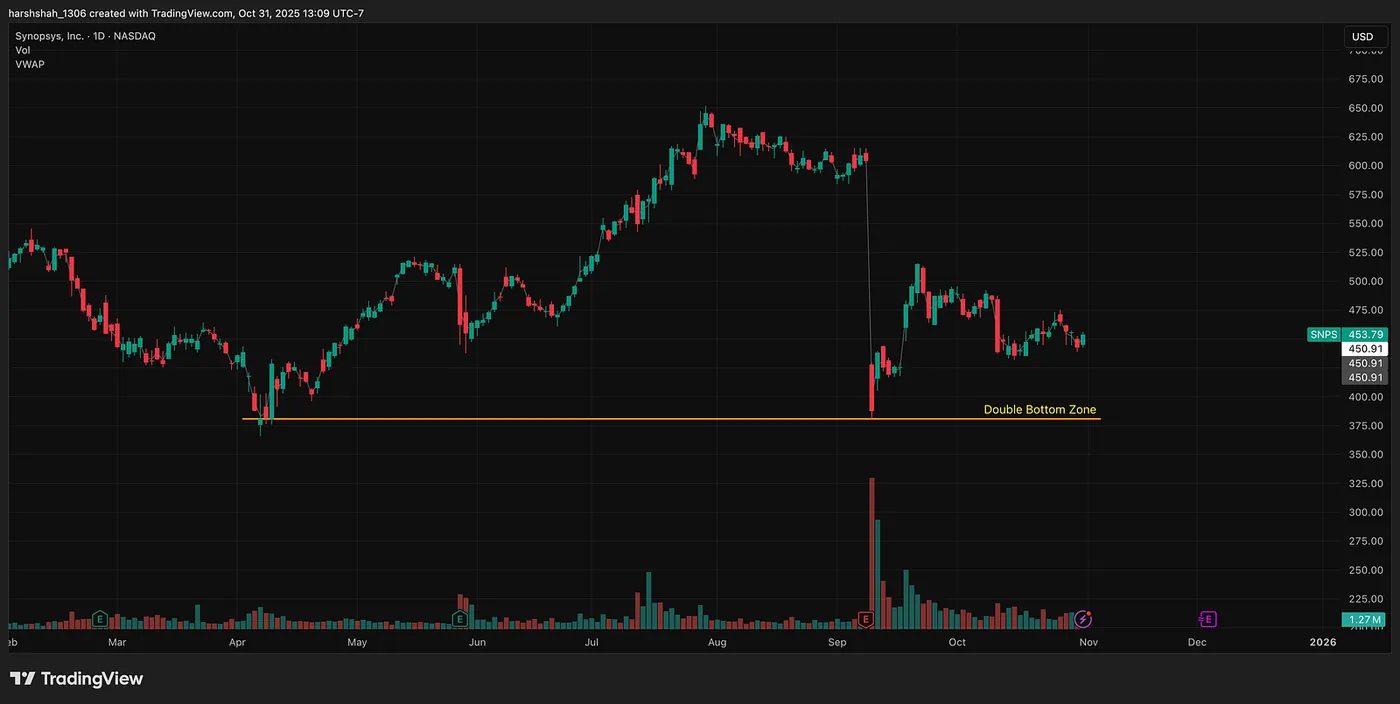
Synopsys — Double bottom in Play
SNPS formed a double bottom in September and has rallied roughly 20% since.
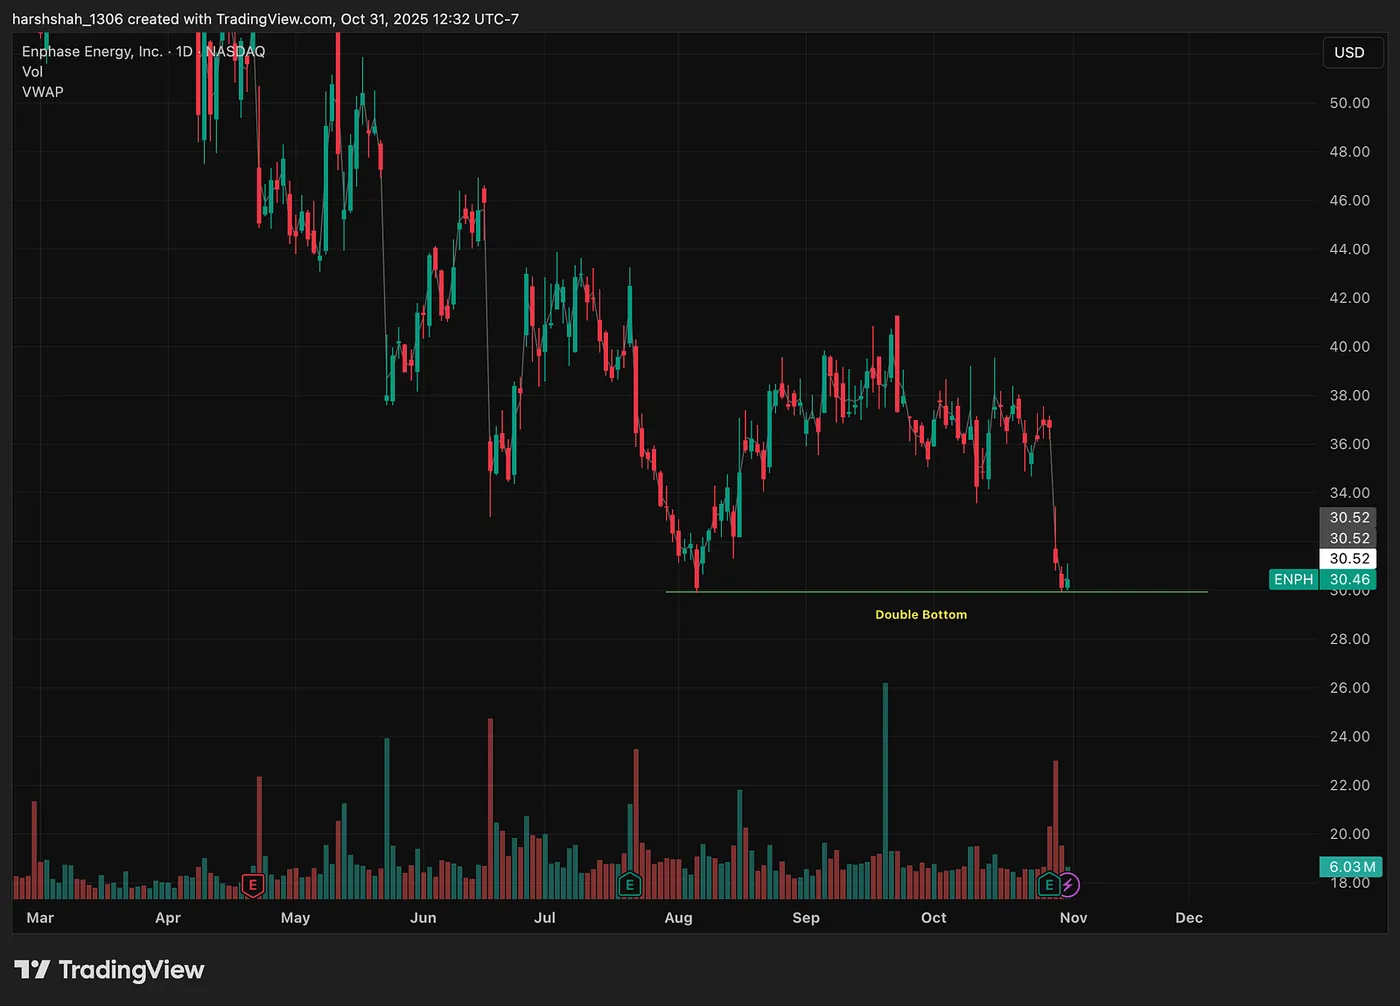
ENPH — Right at Double Bottom, will it play out?
Post-earnings, ENPH is hovering right at a key support zone. Watch for a decisive move — a breakout above or breakdown below — in the coming days.
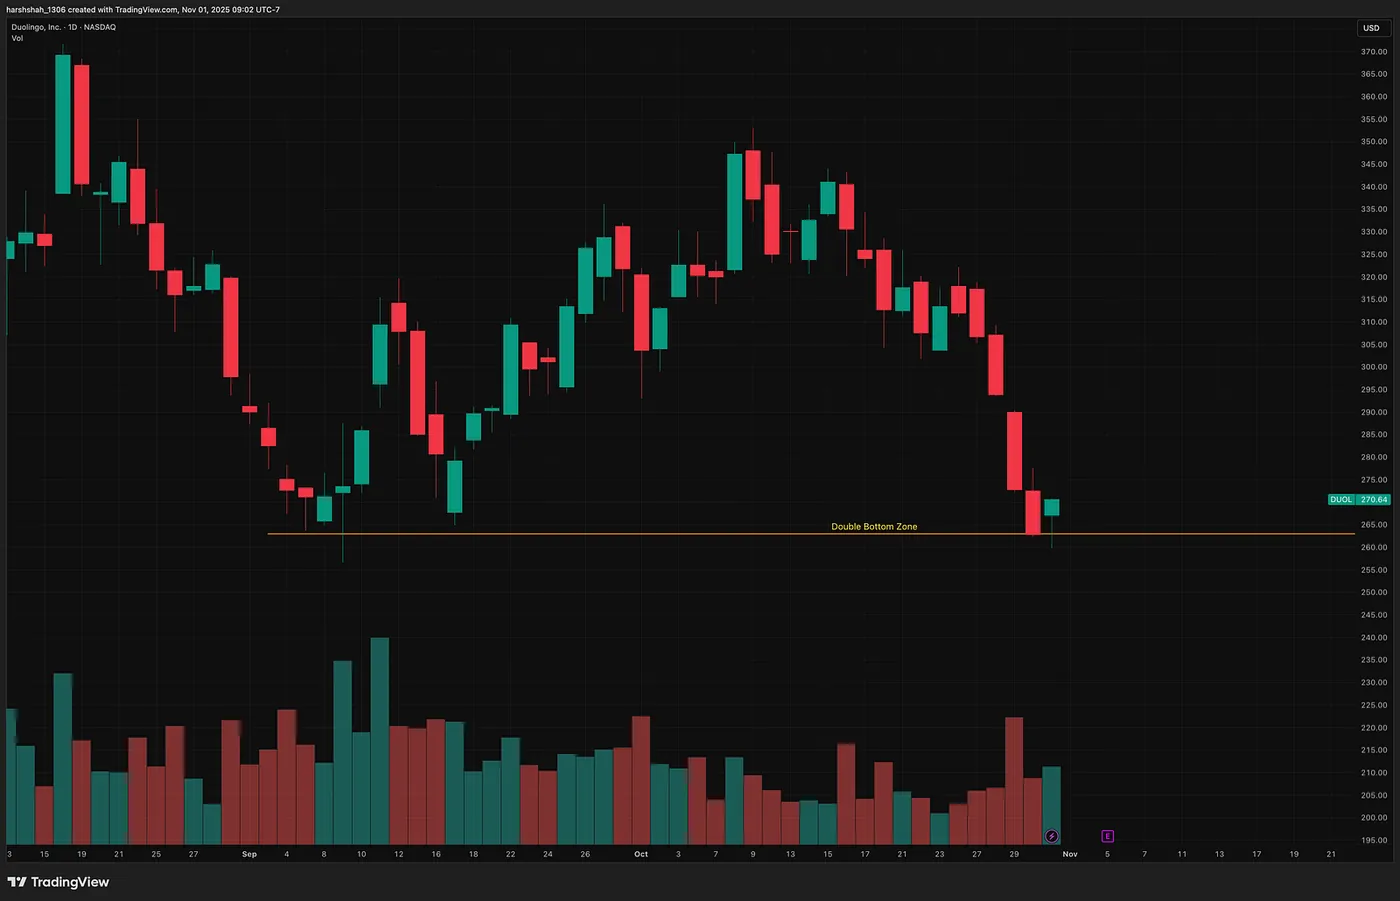
DUOL
The earnings report for DUOL is coming up next week — will the double-bottom setup hold?
Final Thoughts
The Double Bottom is more than just a chart pattern — it’s a story of sellers giving up and buyers stepping in. The first dip shows fear, the second proves sellers are exhausted, and the breakout above the neckline signals strength returning.
It’s not a guarantee, but when confirmed with other signals, the Double Bottom is one of the clearest signs of a potential trend reversal — turning market fear into fresh opportunity.