This Classic Chart Pattern Signals a 48% Upside in Poonawalla Finance
By Harsh Shah · Updated
Disclaimer: This information is for educational purposes only and should not be considered financial advice.
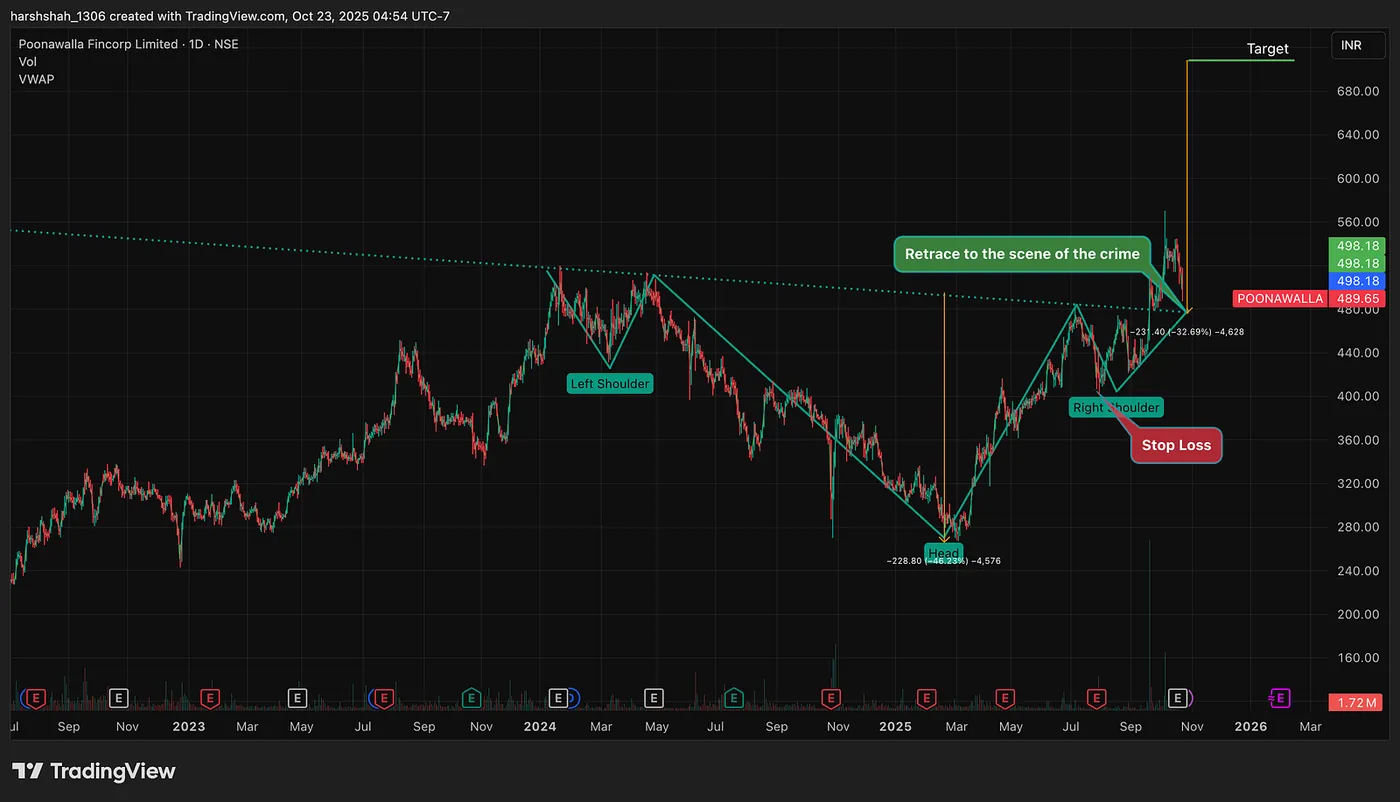
Poonawalla Finance is showing a screaming 48% upside based on this single chart pattern.
Before I reveal why — lets go over a simple, yet power concept, the inverse Head & Shoulders Chart Pattern.
The Inverse Head & Shoulders
The Inverse head & shoulders is one of the most classic chart patterns in trading.
It signals that a downtrend is losing steam and buyers are taking control.
Adowntrendis characterized by a security’s price consistently making lower highs and lower lows over a period of time.
It looks like this:
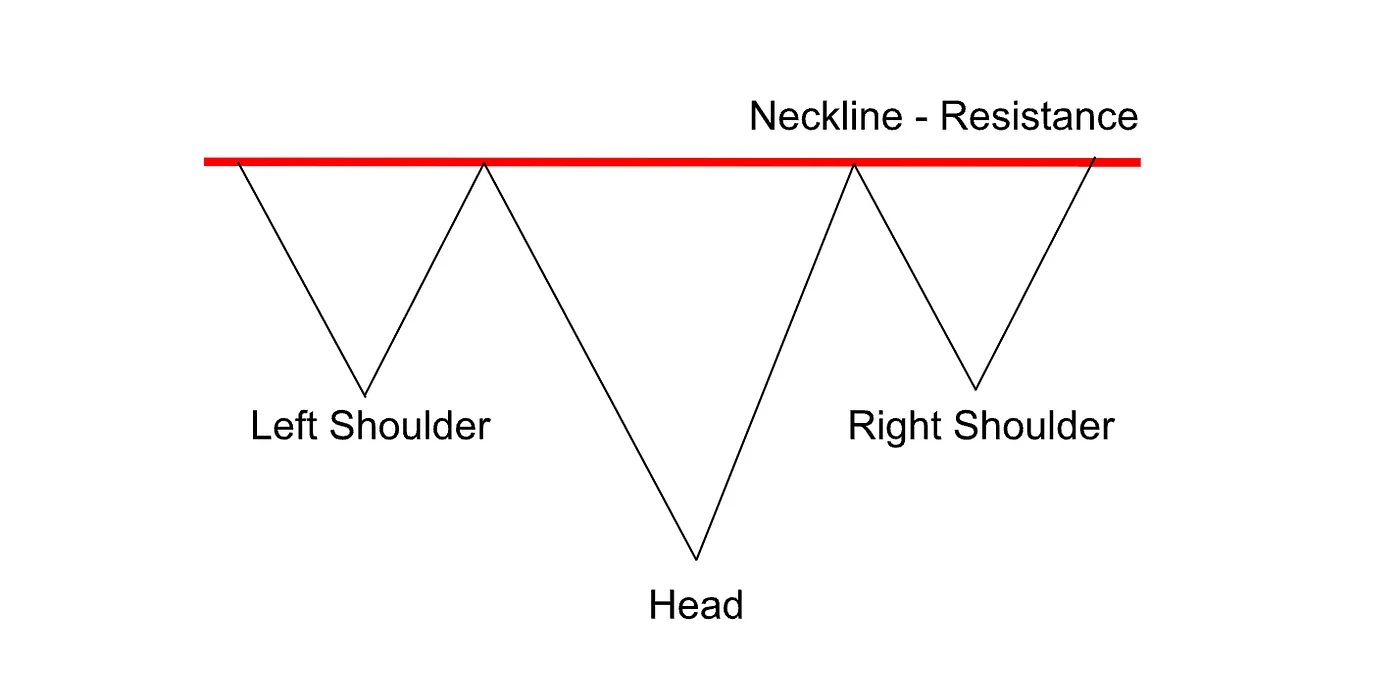
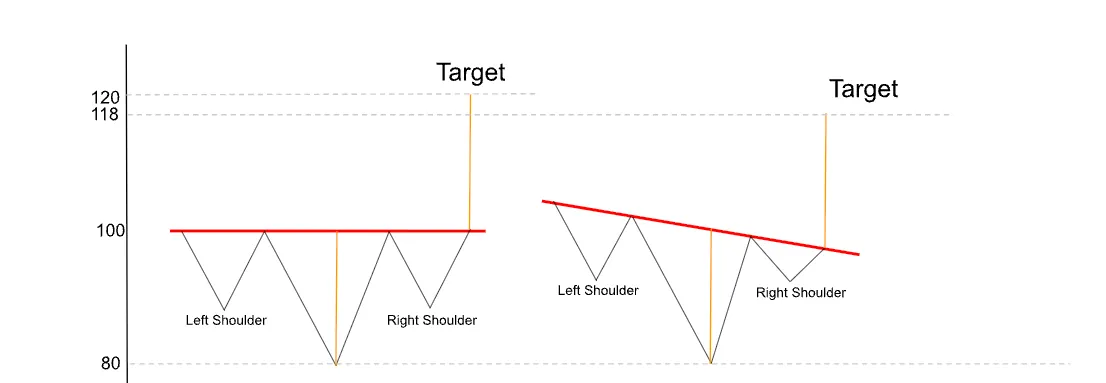
- Left Shoulder: Price falls, bounces, but not too strong.
- Head: Panic selling drives the price sharply lower (capitulation), followed by a quick rebound.
- Right Shoulder: Price falls again, but this time sellers can’t push it as low as before.
That inability of sellers to make a new low(right shoulder) is the first big clue that momentum is shifting (the downtrend is changing).
At the top of the pattern, there’s a neckline (acting as resistance) — once price breaks above it and confirms, the trend has officially turned bullish.
Why the name — inverse Head & Shoulders ?
The inverse Head and Shoulders pattern looks exactly like a person’s head — a deep central low (the head) between two shallower lows (the shoulders) — only it’s upside down.
The Psychology Behind It
Why does this work? It’s all about human behavior.
- Left Shoulder: Traders still bearish, selling pressure remains.
- Head: Panic — everyone thinks the trend is over, so they dump. Smart money quietly buys.
- Right Shoulder: Sellers try again but can’t drive price as low. Confidence shifts. Buyers step in earlier.
- Neckline Break: Now, even the skeptics join the party. Short sellers panic and cover, while new buyers pile in. Momentum flips.
Simply put:
👉 Sellers get weaker.
👉 Buyers get stronger.
👉 Breakout = momentum shift confirmed.
Key Rules for Identifying the Inverse Head & Shoulders
Must Be Symmetrical: For the best chance of success, the pattern needs a balanced, human-like appearance. Any significant unevenness will sharply reduce the probability of a positive outcome.
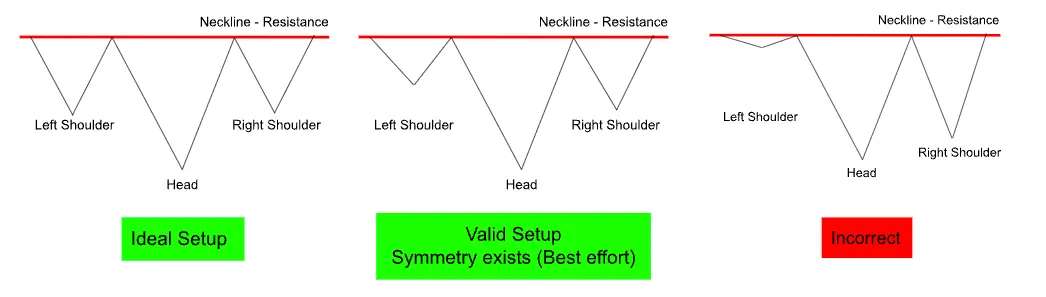
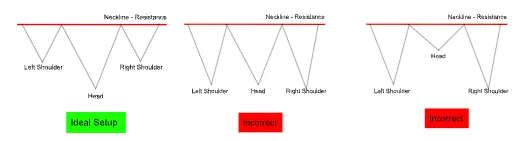
Head Must Be Deepest: The two shoulders must be shallower than the central head low.
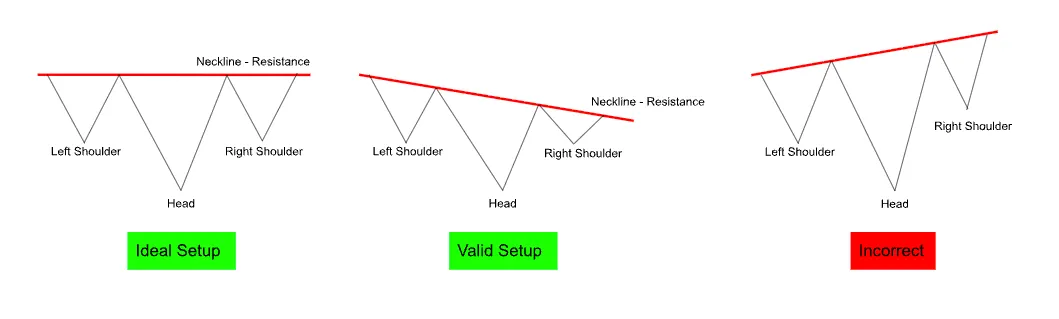
Neckline Angle: Focus on a neckline that is flat or slanting downward. To maximize the chance of success, the angle of this slope should ideally fall between 0 and 45 degrees. (Avoid an upward-sloping neckline.)
Determining The Target: To calculate the target price:
- Measure the vertical distance from the head (the lowest point) to the neckline.
- Project that exact distance downward starting from the price level where the stock breaks below the neckline. This projected point is your target price.
Why This Helps You Trade
The inverse head & shoulders is powerful because it:
- Signals a clear momentum shift — from downtrend to uptrend.
- Gives structure for entries — you know to buy the breakout above the neckline.
- Offers risk management — stop loss usually goes below the right shoulder or any confirmed close below the neckline.
- Provides a profit target — the distance from the head to neckline often projects the next move.
Power Factors (When the Pattern is Strongest)
- Location: The pattern is most powerful when it forms at the very bottom of a downtrend.
- Timeframe: The longer the timeframe, the stronger the signal. A Monthly chart signal is more reliable than a Weekly signal, which is more reliable than a Daily signal and so on.
- Confirmation Signal: When the neckline breaks, look out for confirmation signal.
- Retrace to Scene of the Crime (Ideal Entry): The ideal entry is on a retest of the breakout level. If the price doesn’t pull back and the move is confirmed, you can still enter to avoid missing the trade, but be aware this will likely lower your potential risk-to-reward ratio.
- Stop Loss: A downside breakout of the neckline must be confirmed. Hold your entry until confirmation is established.
PoonaWalla Finance: A 48% Opportunity
Let’s break down why this stock is setting up for a strong risk-to-reward opportunity.
July 28, 2025
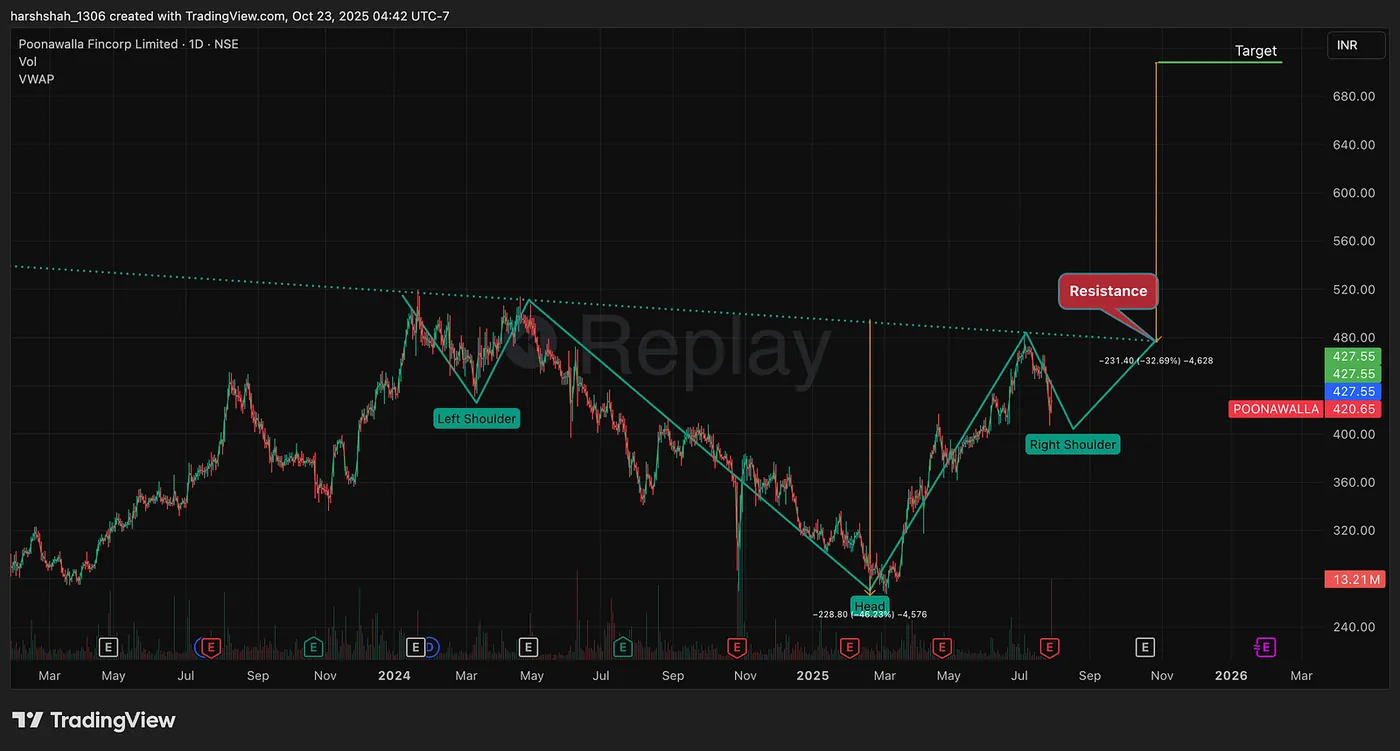
The chart began forming a clear Inverse Head & Shoulders pattern, with a key resistance zone near Rs. 478 — the neckline. A breakout above this level was the first signal to watch for.
September 18, 2025
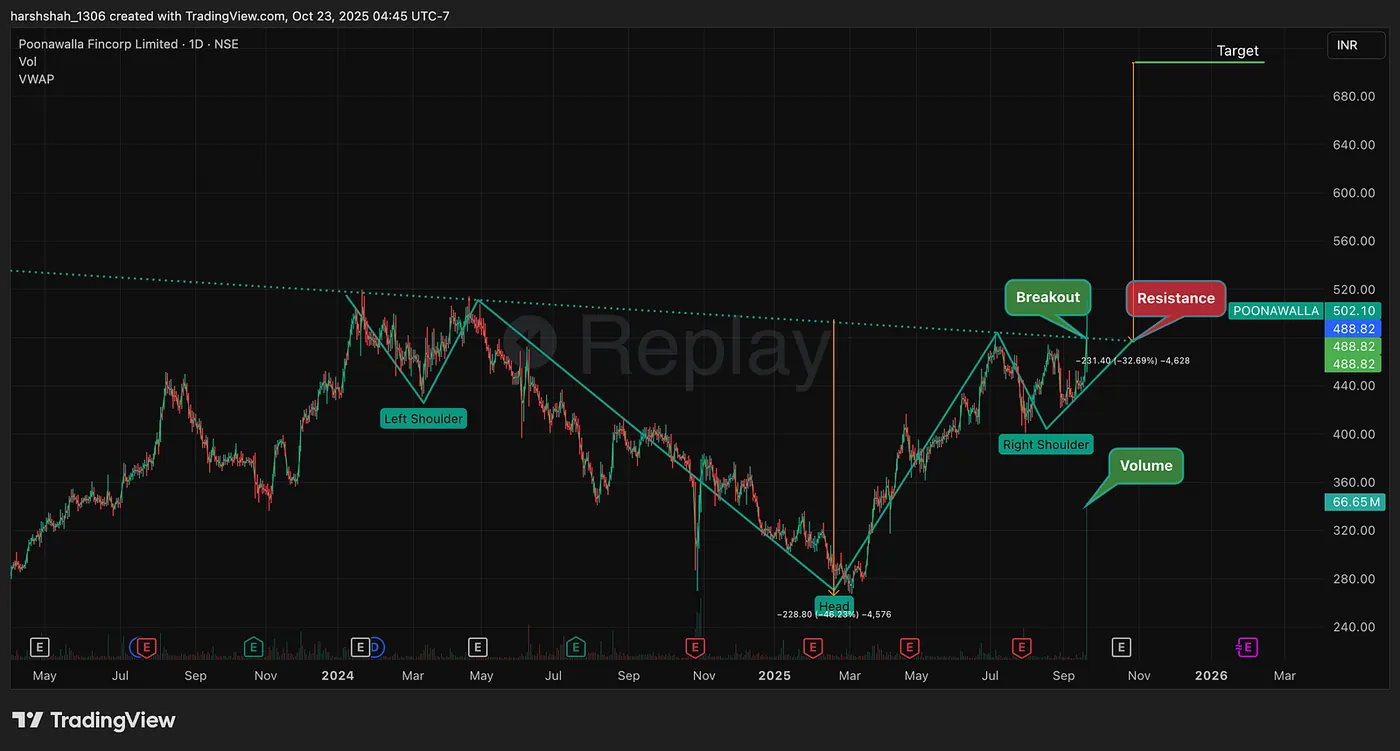
Soon after, the stock broke above the neckline with a sharp surge in volume, signaling renewed buying interest. The next step was to wait for confirmation — a decisive close above the breakout candle’s high at Rs. 513.
October 3, 2025
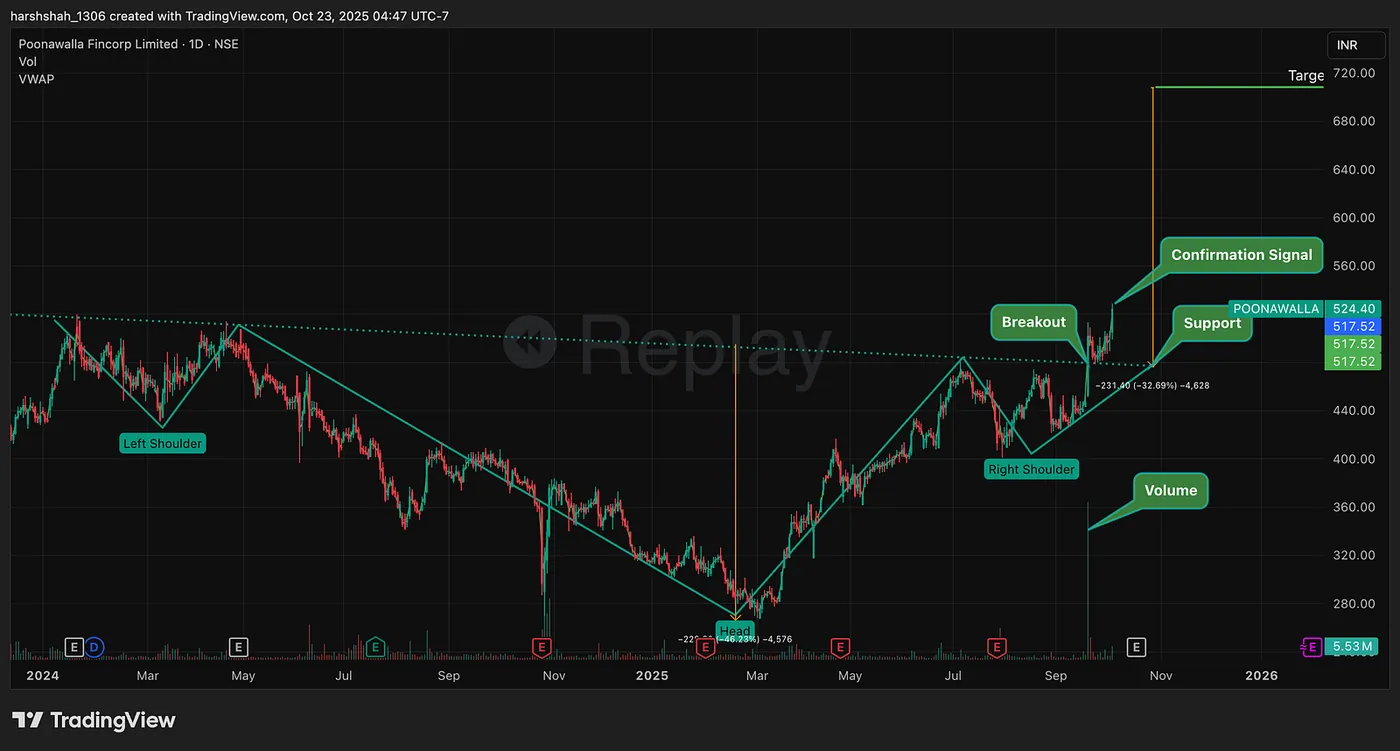
That confirmation came right on cue. With the close above Rs. 513, the breakout was validated, turning the previous resistance (neckline) into new support.
At this stage, traders could begin building a position, or ideally, wait for the retest of the breakout zone — often called the “scene of the crime.”
Oct 23, 2025
Now, as the stock retraces toward Rs. 478, it’s approaching that ideal entry zone again — a strong setup for a potential bounce.
A stop loss should be placed just below the right shoulder low, confirmed by any close below that level.
Lets look at some past case studies where this infamous pattern has played out!
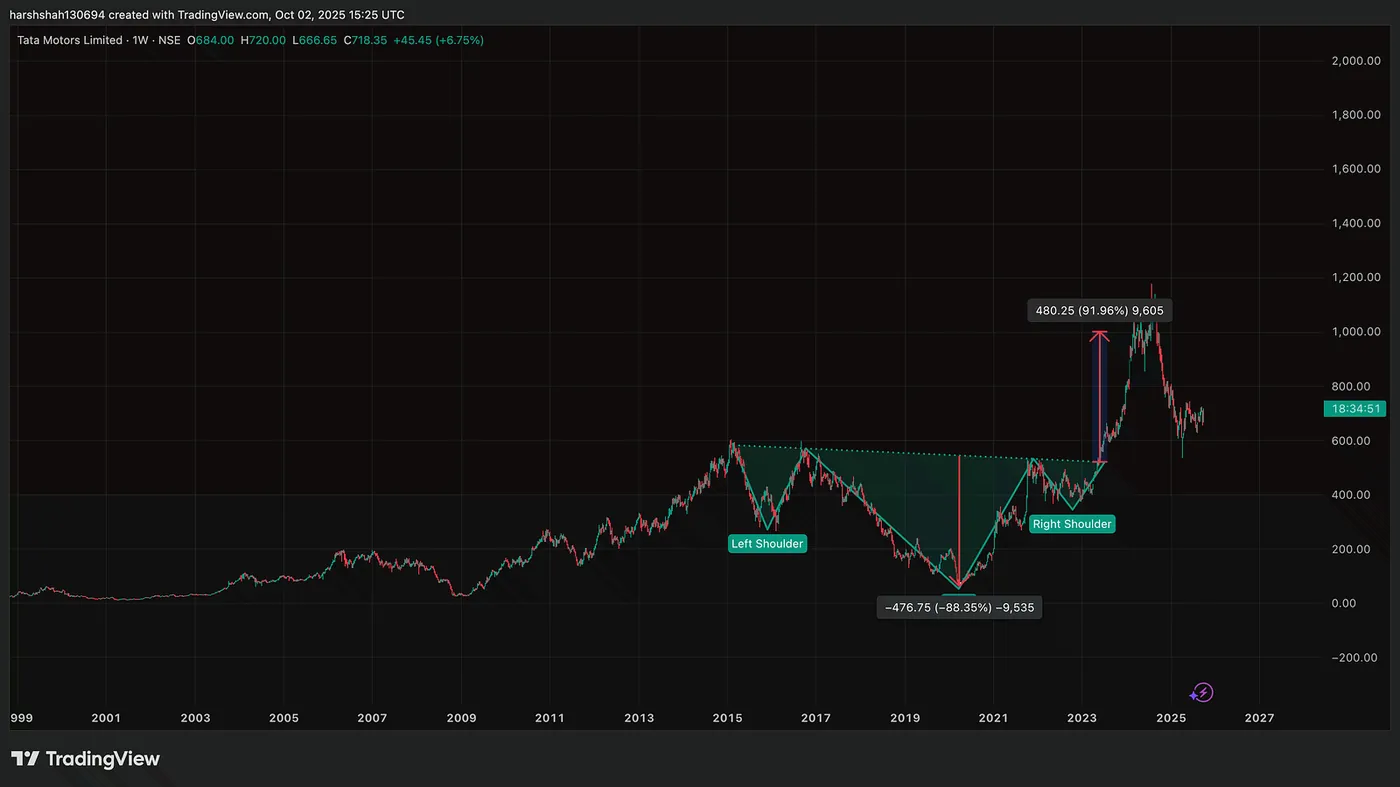
Tata Motors: Case Study: ~90% Opportunity
In 2023, the Inverse Head & Shoulders breakout in Tata motors offered a powerful trade setup.
Entry: ~Rs.523
Exit: ~Rs. 1000
Stop loss: Rs. 480 (confirmed close below neckline!)
Gain: ~91.96%
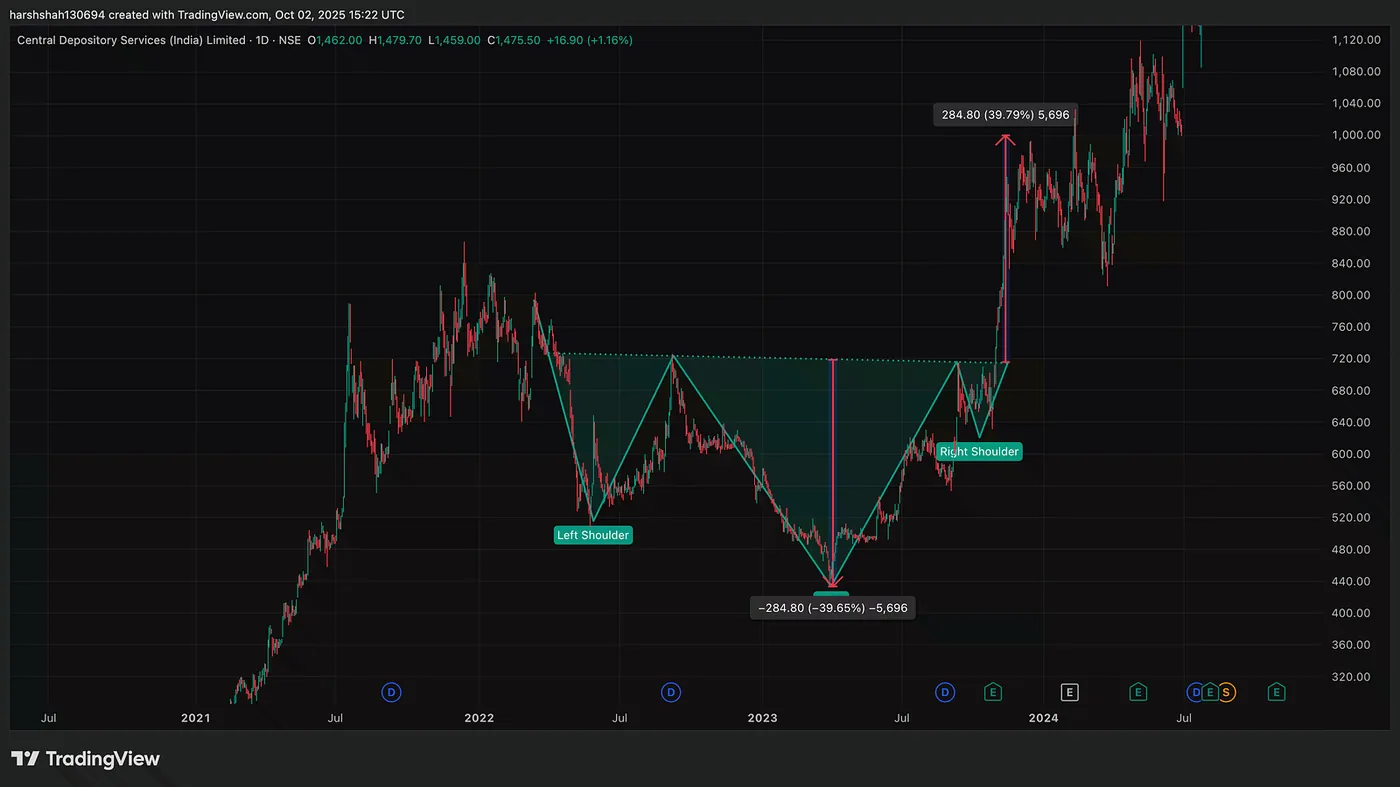
CDSL — Case Study: A 40% Opportunity
Entry: ~Rs.713
Exit: ~Rs. 1000
Stop loss: Rs. 690 (confirmed close below neckline!)
Gain: ~40%
Final Thoughts
The inverse head and shoulders pattern isn’t just a drawing on a chart — it’s a visual story of changing sentiment.
It shows the exact moment when sellers start losing control and buyers quietly take over.
If the setup in Poonawalla Finance plays out, it could mark the early stages of a trend reversal — one that rewards patience and disciplined execution.
As always, remember: no pattern is foolproof. The key lies in confirmation, position sizing, and managing risk.
Use these setups not to predict the market, but to align yourself with momentum once it’s confirmed.
I’m creating a full technical analysisseriesthat breaks down chart patterns — from consolidations and wedges to breakouts and reversals — using real-world examples.