How I earned 3017$(~10%) in 5 days using simple Technical Analysis
By Harsh Shah · Updated
Disclaimer: This information is for educational purposes only and should not be considered financial advice.
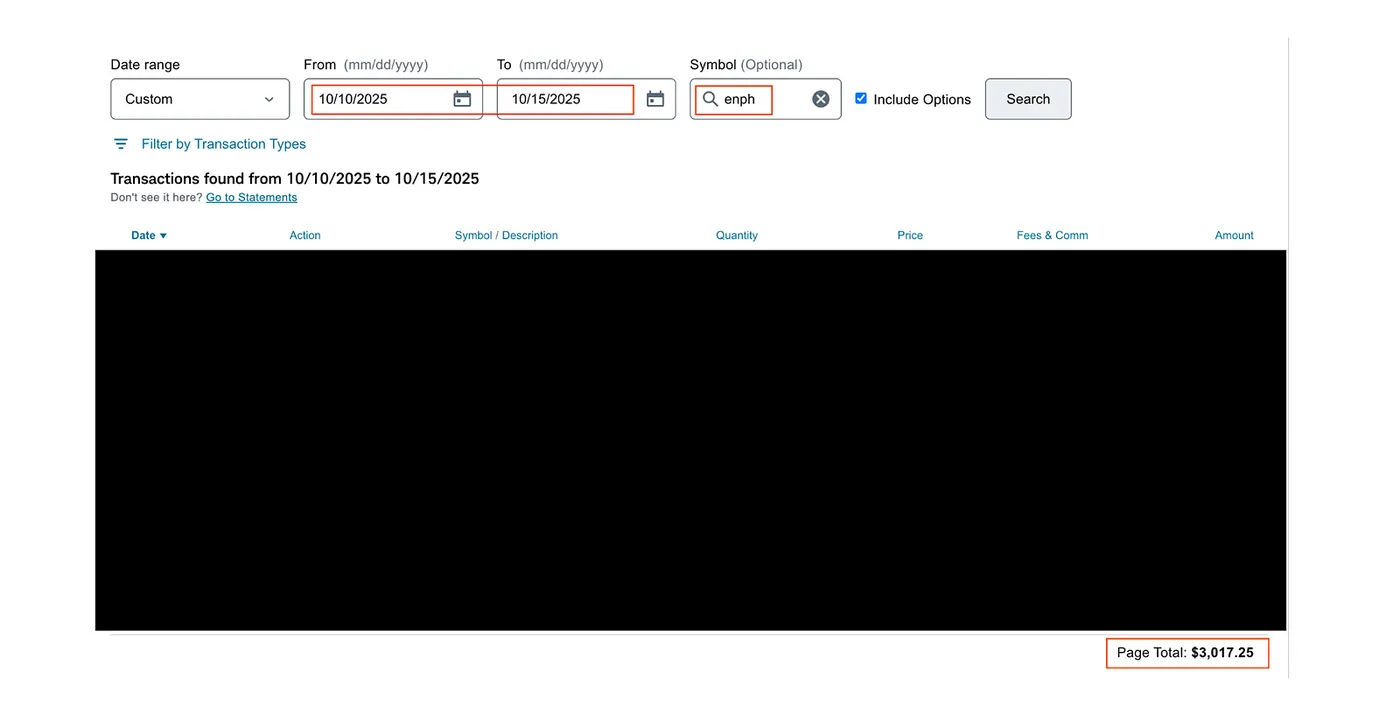
Ever wondered how traders spot opportunities before the crowd catches on?
No fancy indicators. No paid alerts. Just pure price action and discipline.
In this post, I’ll walk you through a real trade I took on Enphase Energy (ENPH) — from spotting the setup to booking a 10% gain in just five days.
You’ll see exactly how simple technical analysis (when applied patiently) can help you catch clean, high-probability moves — without staring at screens all day.
Before we jump into a real-world example, I recommend a quick refresher on these core technical analysis concepts. Understanding them will help you follow along and get the most out of the breakdown:
- Support and Resistance
- Wedge Patterns
- Confirmation Signals
- The “Retrace to the Scene of the Crime”
Now, let’s apply these concepts in a practical, step-by-step example.
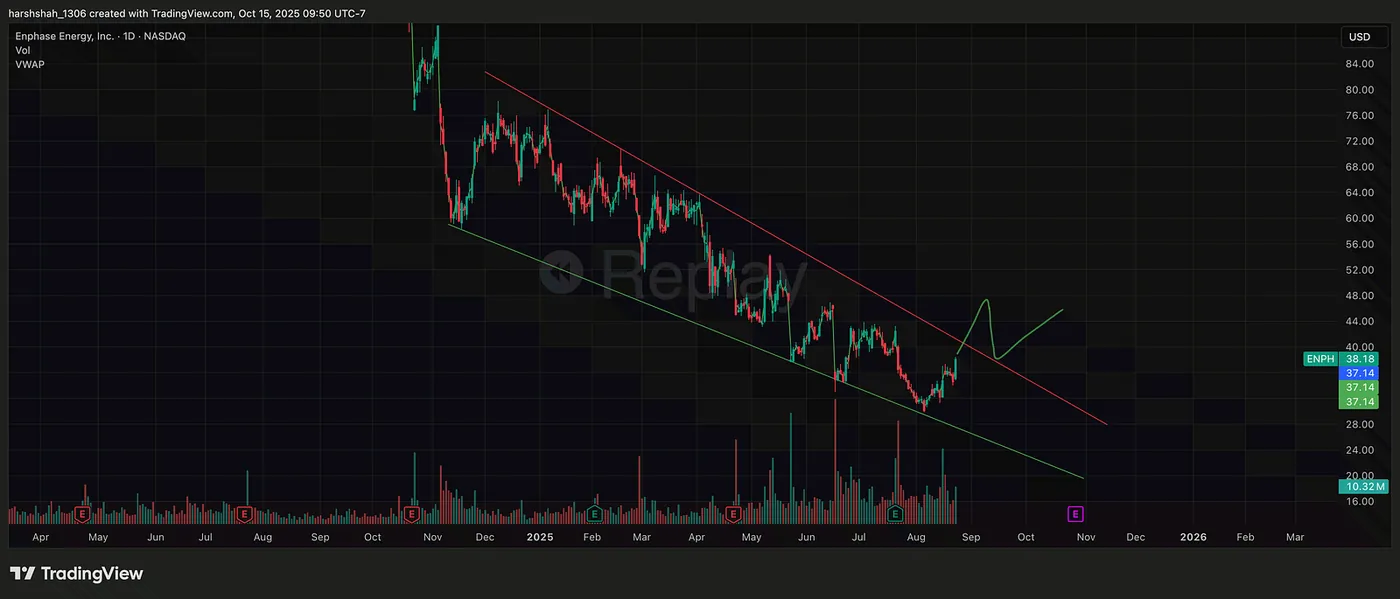
August 22nd: Added ENPH to my watchlist
Enphase (ENPH) has plummeted approximately 90% from its December 2022 peak and is now consolidating in a falling wedge pattern. A breakout from this formation is typically a bullish signal, so I have added the stock to my watchlist to monitor for a potential trading opportunity.
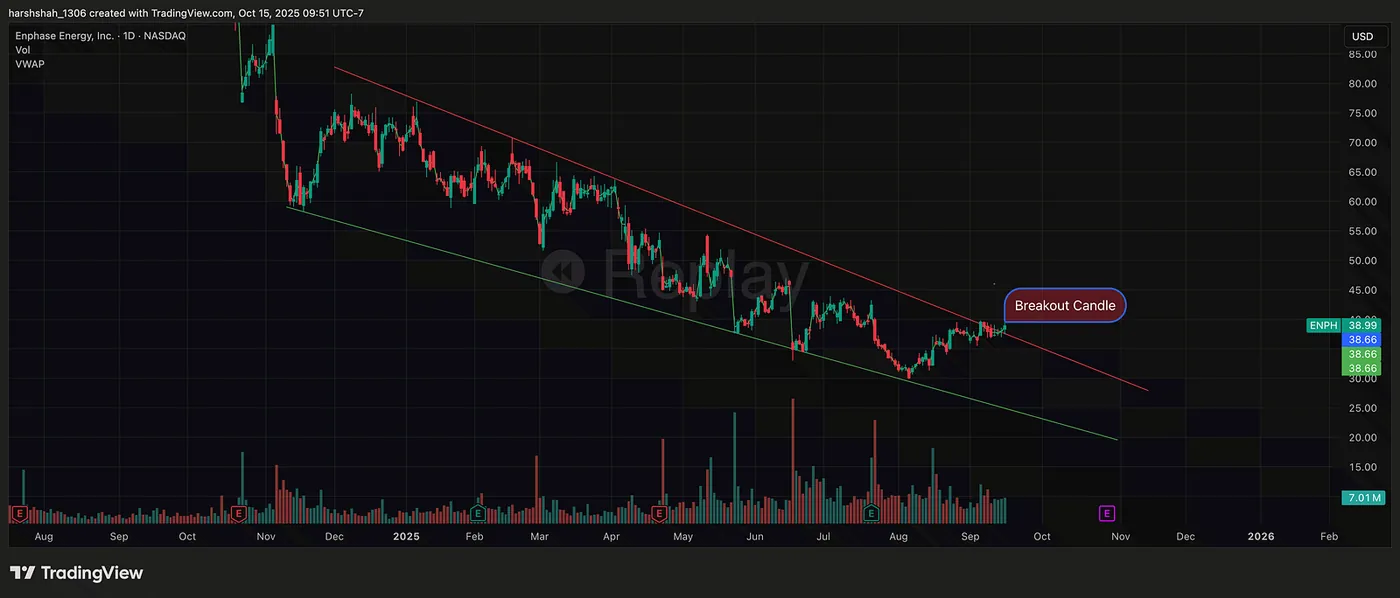
September 16: Breakout From Resistance
About a month later, the stock attempted to break through the wedge’s resistance line. However, as we discussed in our post on confirmation signals, this could be a fakeout. To confirm a valid breakout, we need to see a daily close above the high of the breakout candle (~39.42$). The watch for that confirmation now begins.
September 22: Breakout Confirmed
A week later, a close at $40.52 confirmed the breakout. The previous resistance level has now flipped to become support. The ideal buy zone would be on any retrace back to this new support level, also known as a “return to the scene of the crime.”
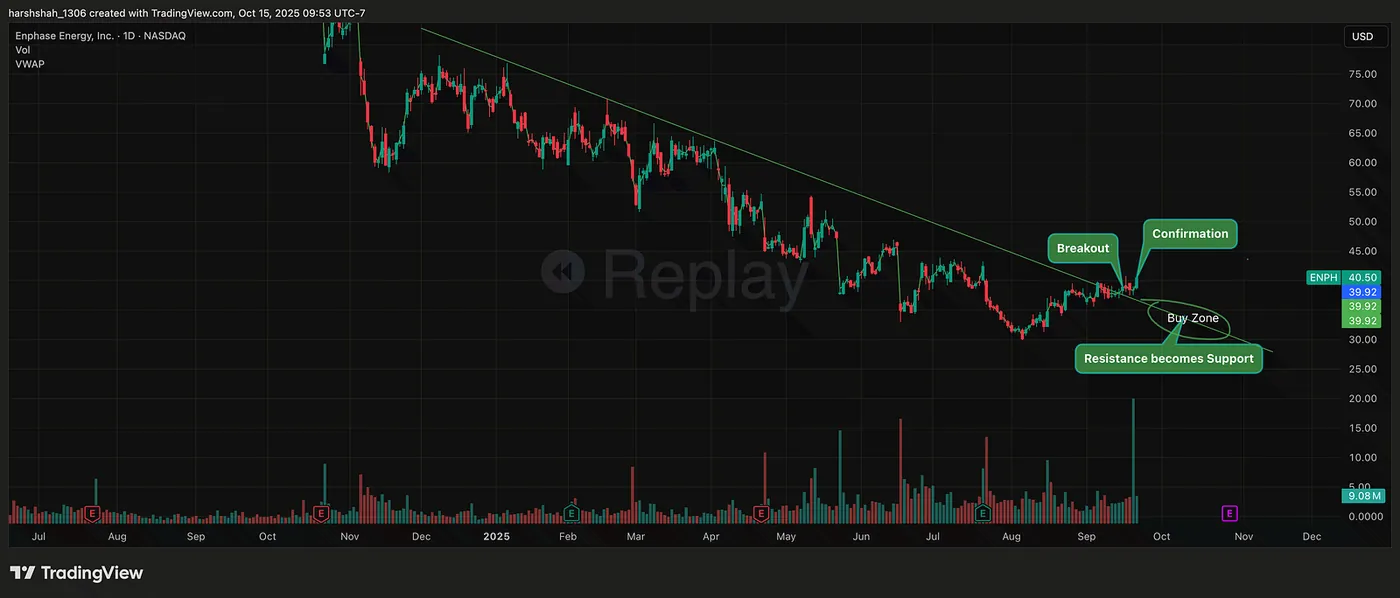
October 10: Retrace to Support, Entered Long Trade
The price then pulled back to the support line(look at the volume spike) at approximately $34, which was my signal to enter a long position. I set my stop loss for any confirmed close below this support level.
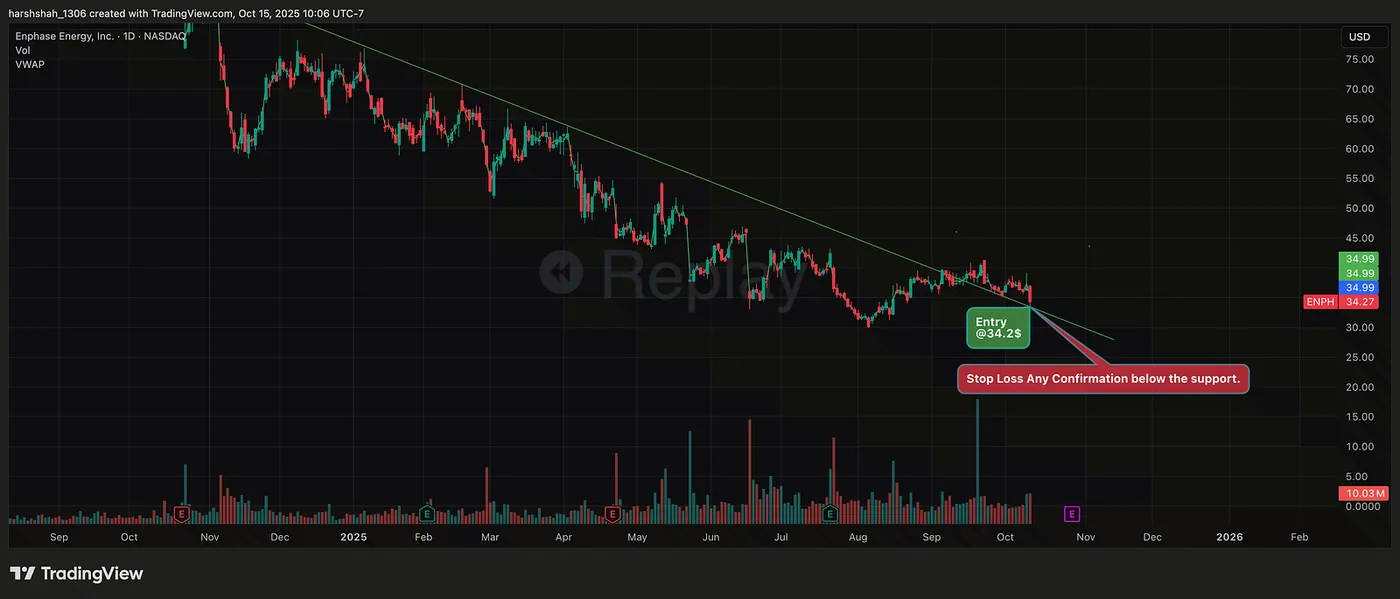
October 15: Covered, ~10% profit
The setup played out perfectly. The stock saw a swift 10% increase over the next five days, allowing me to exit the position and secure profits at my target of ~$38.50.
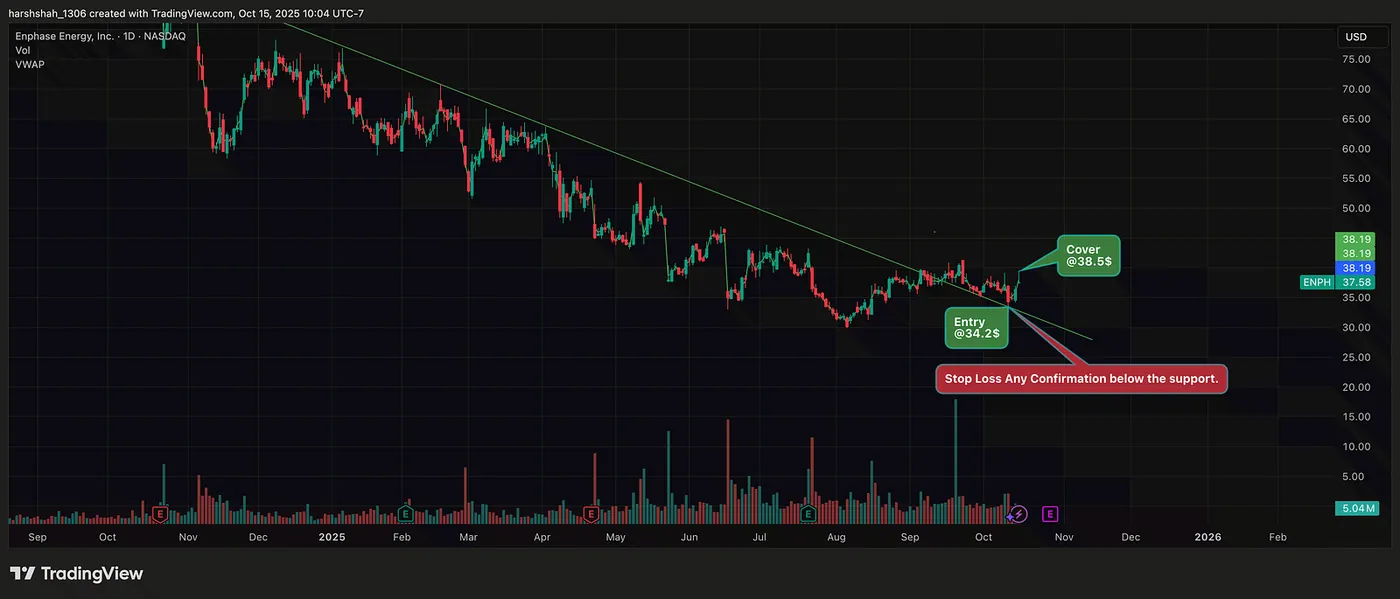
My decision to book profits at a ~10% gain rather than wait for a larger move was a matter of discipline. Here was my reasoning:
- Plan Adherence: I had a profit target and an exit strategy in place before entering the trade. I simply executed that plan.
- Lack of Fundamental Conviction: This was a technical play. I didn’t have the deep fundamental knowledge of the company required to hold it as a long-term investment.
- Risk Management: The longer you’re in a trade, the more you’re exposed to unknown market events. I captured the expected move and removed my risk.
- Repeatability: The trade is more valuable than the outcome. If the same low-risk setup appears again, I can re-enter.
Final Thoughts
This trade wasn’t luck — it was preparation meeting opportunity.
I didn’t chase the breakout; I waited for confirmation, respected support, and trusted the setup. That’s what separates trading a pattern from gambling on noise.
The key takeaway?
👉 Let the chart tell the story.
👉 Let patience do the heavy lifting.
Technical analysis isn’t about predicting — it’s about reacting with discipline when probability tilts in your favor.
I’m creating a full technical analysisseriesthat breaks down chart patterns — from consolidations and wedges to breakouts and reversals — using real-world examples.