Microsoft: The $390–$400 Zone I’m Watching Closely
By Harsh Shah · Updated
Disclaimer: This content is for educational purposes only and should not be considered financial advice.
When Microsoft ripped back toward $550, technical analysis warned me well in advance that this move was extended and vulnerable to rejection.
Price eventually proved that right.
The second time MSFT attempted the same level, it formed a classic double top — a textbook setup for traders looking to fade strength or lock in gains.
Fast forward to today:
After earnings, MSFT has been sold aggressively. And now, it’s finally heading toward the zone I’ve been patiently waiting for.
Will it get there?
I don’t know.
But if it does, technical analysis suggests it could be a high-probability bounce area.
Let me walk you through how I’ve been tracking it step by step.
If you found my blogs helpful and learned something new about investing, consider following me on Medium to get notified when I publish new articles.
Quick Context (Worth Knowing)
To follow this breakdown, it helps to understand:
These are simple concepts — but powerful when combined.
August 1, 2025 — When TA Said “Don’t Chase”
MSFT surged to $550 after earnings.
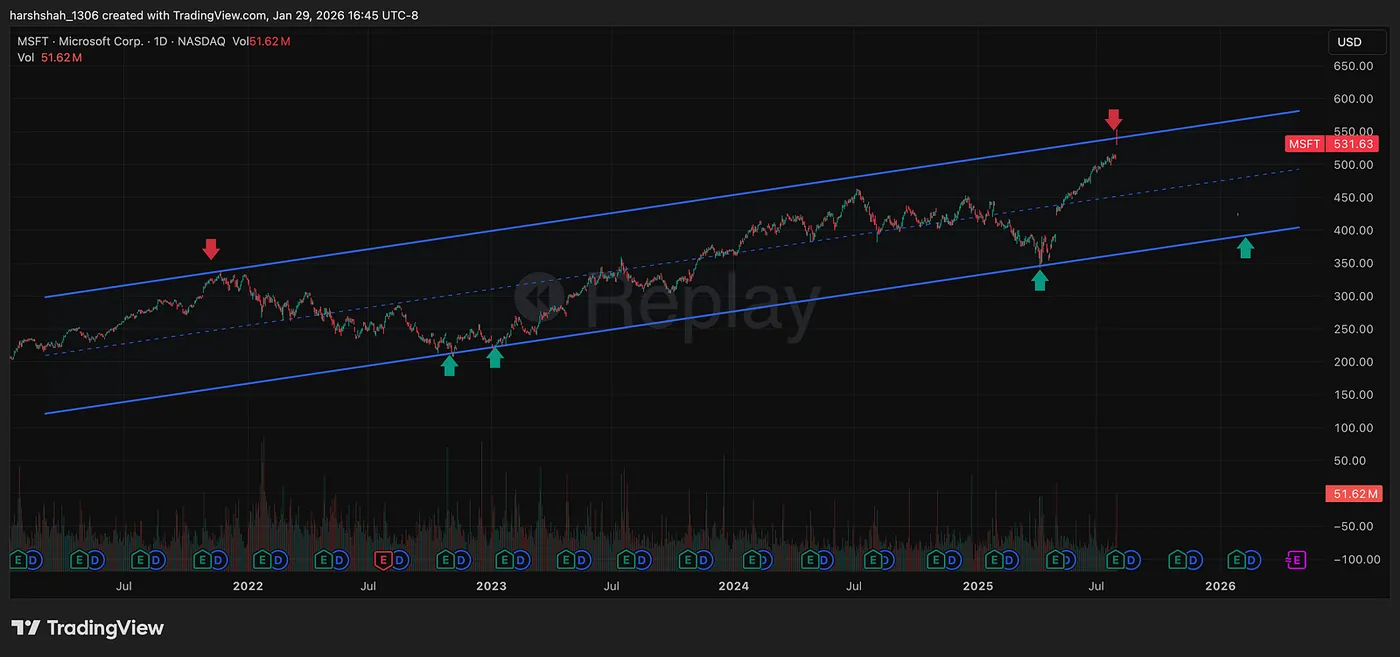
Was I a buyer there?
Absolutely not.
That was a FOMO zone, not an opportunity.
At the time, I had already mapped a parallel channel that clearly defined the stock’s upper and lower bounds. My plan was simple:
If price pulls back to the lower end of the channel, I’d be interested.
Until then, I do nothing.
Technical analysis helps me stay out of bad trades/investments just as much as it helps me find good ones.
October 28, 2025 — The Second Rejection
Two months later, price retested the highs again.
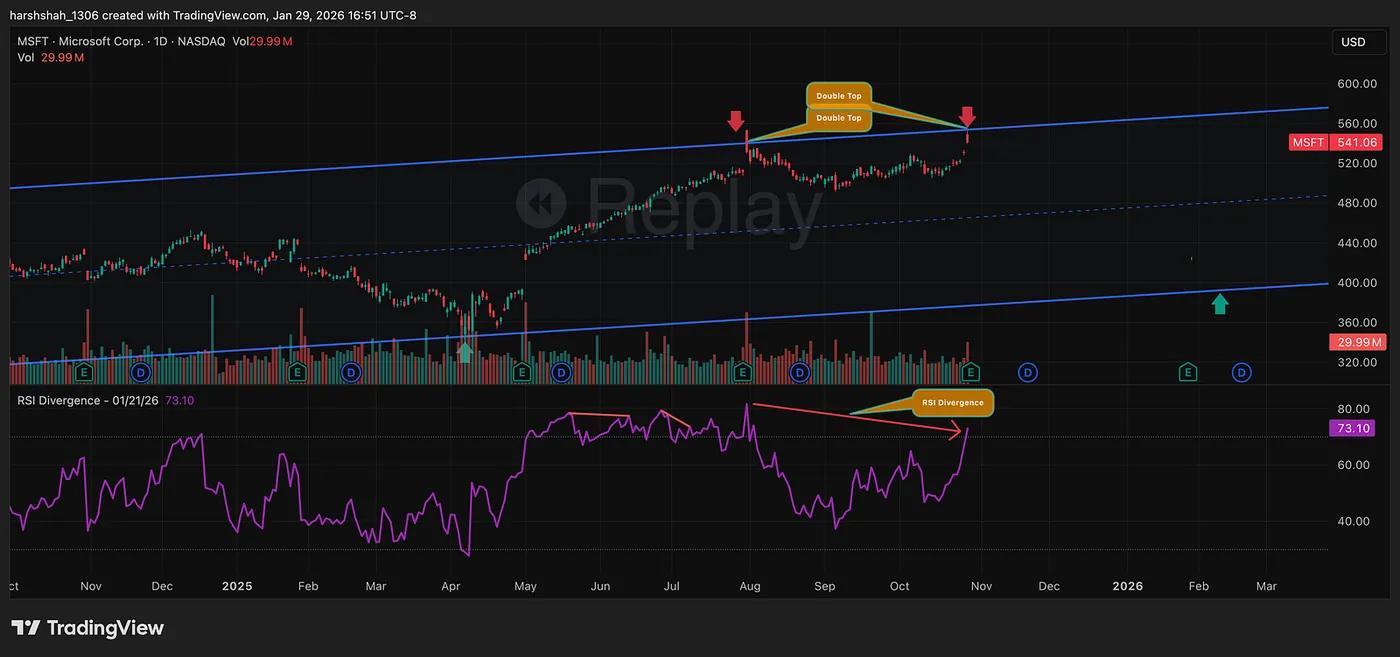
This time, the setup was even cleaner:
- Top of the parallel channel
- Clear double top
- RSI bearish divergence
For experienced traders, this was a high-confidence short or sell-into-strength setup.
Once again, TA wasn’t saying “buy.”
It was saying “be careful.”
Jan 29th, 2026 — Where Things Get Interesting
After earnings, MSFT dropped roughly 10% and is now sliding toward the lower boundary of the parallel channel.
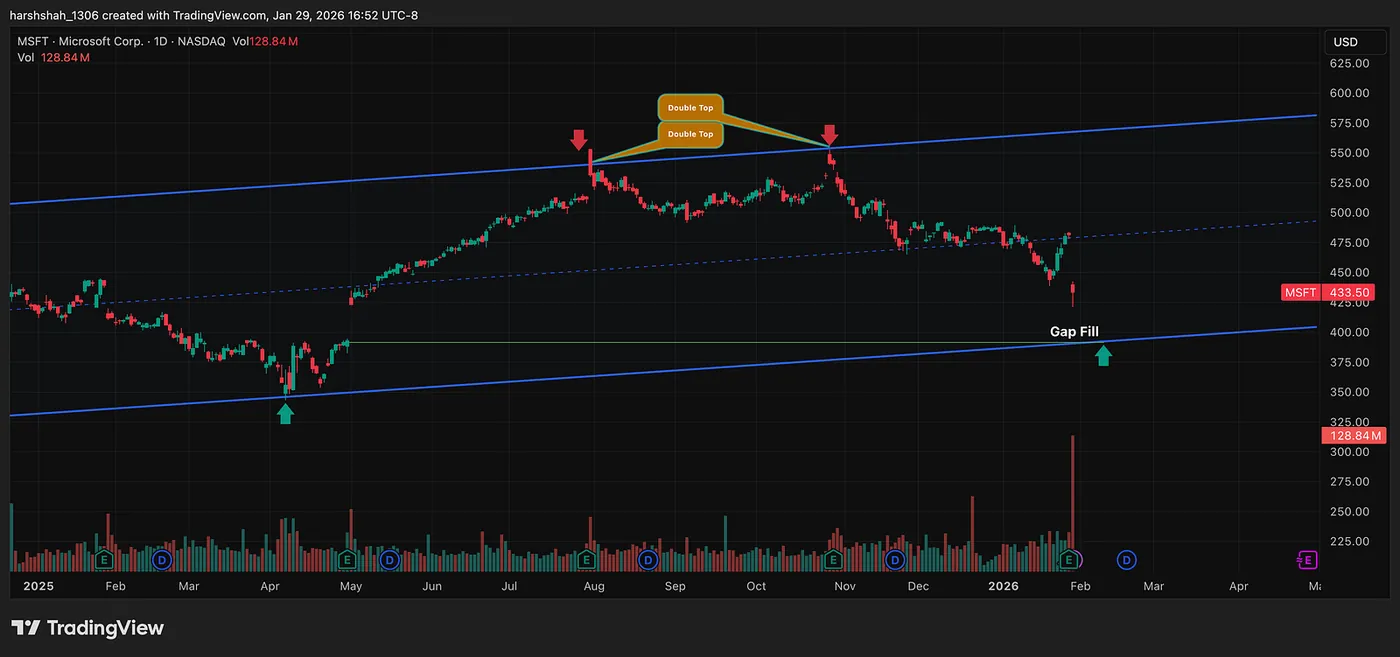
At the same time, there’s an open gap below, creating a strong area of confluence.
That gives us a two-factor high-probability zone:
- Lower end of the channel
- Gap fill area
The zone I’m watching closely sits around $390–$400.
If price reaches that area and shows signs of stabilization, it becomes interesting.
Until then — I wait.
Will It Get There?
Honestly — I don’t know.
And I’m okay with that.
One of the biggest shifts in my trading journey was learning to stop chasing trades. There is always another opportunity around the corner.
As and when I find high-quality setups, I share them here:
👉 datadriveninvesting.io/chartsetups-us
For instance,
Meta at 585$: https://www.datadriveninvesting.io/setup/us/META-2025-12-08 and many others.
You can sign up to get notified when a new setup is posted — it’s completely free.
Final Thoughts
This isn’t about predicting the exact bottom.
It’s about waiting for price to come to you, at levels where risk is defined and probabilities improve.
Microsoft didn’t become interesting at $550.
It becomes interesting after fear shows up — not before.
Patience keeps you out of bad trades.
Structure helps you spot good ones.
And that combination is what turns technical analysis into a real edge.