Netflix Is Down 44% — Now Things Are Getting Interesting…Here’s Why
By Harsh Shah · Updated
Disclaimer: This content is for educational purposes only and should not be considered financial advice.
Netflix has taken a significant hit.
After reaching around $133 in July 2025, the stock has fallen roughly 44%, now trading near $76 per share.
Interestingly, when Netflix was near its highs, I had zero interest in buying it. The risk-reward simply wasn’t attractive.
But after a sharp decline like this… things start to change.
Big selloffs create fear. Sentiment shifts. Investors who were confident at the top suddenly become uncertain — and that’s often where opportunities begin to emerge.
This is where technical analysis becomes valuable. Not to predict the exact bottom, but to stay grounded while emotions run high.
I don’t know if Netflix has bottomed.
But at these levels, with price approaching important zones and my custom indicator providing structure, the stock is starting to get interesting.
Let’s take a closer look.
Stick with me till the end — there’s a real wow moment that came up while I was analyzing the stock’s past behavior.
Before We Start — Key Concepts
If you’re newer to technical analysis, it helps to understand:
These concepts will make the chart much clearer.
September 2024 — Netflix Testing the Cup & Handle Neckline
Back in September 2024, Netflix was repeatedly testing the Cup & Handle neckline resistance.
Based on the pattern structure, a confirmed breakout projected a target near $120.
At the time, this was a classic textbook setup — pressure building beneath resistance.
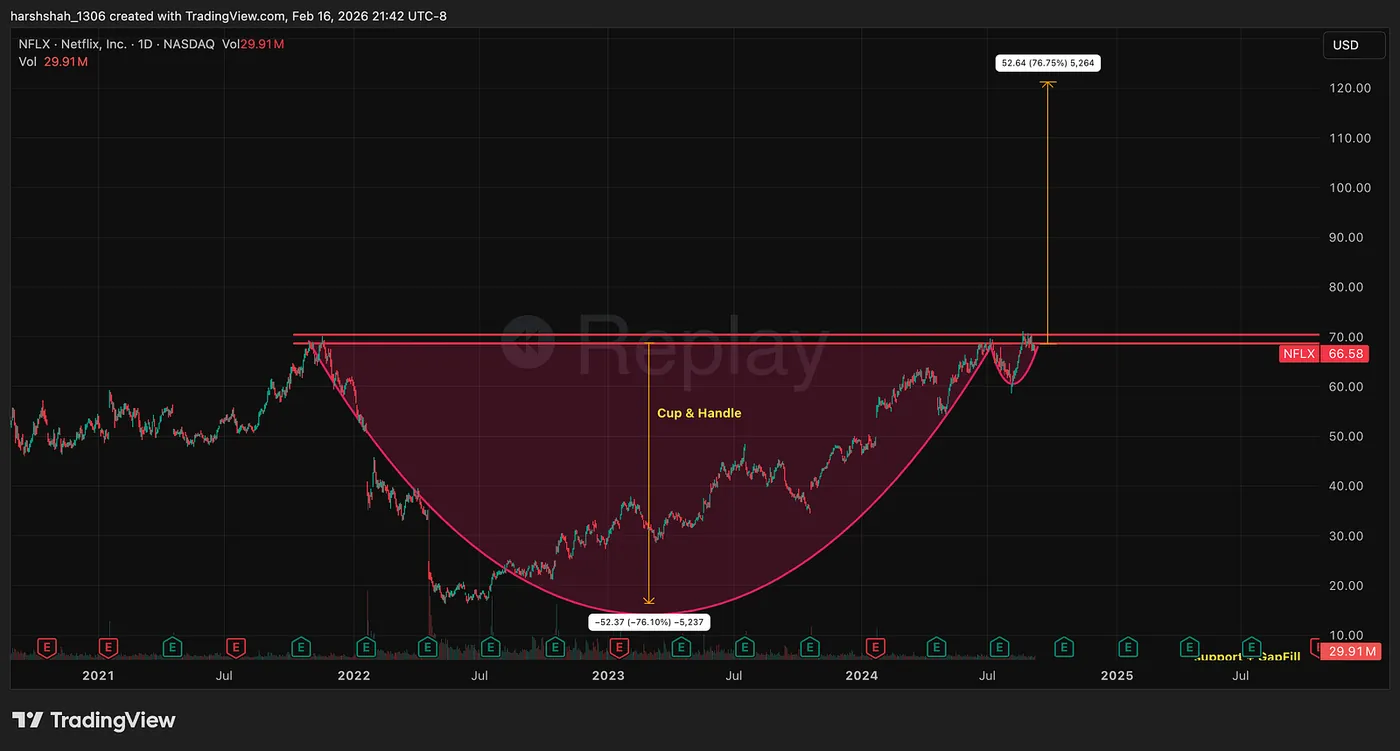
May 2025 — Target Achieved: 75% Gain in 9 Months
The breakout eventually happened.
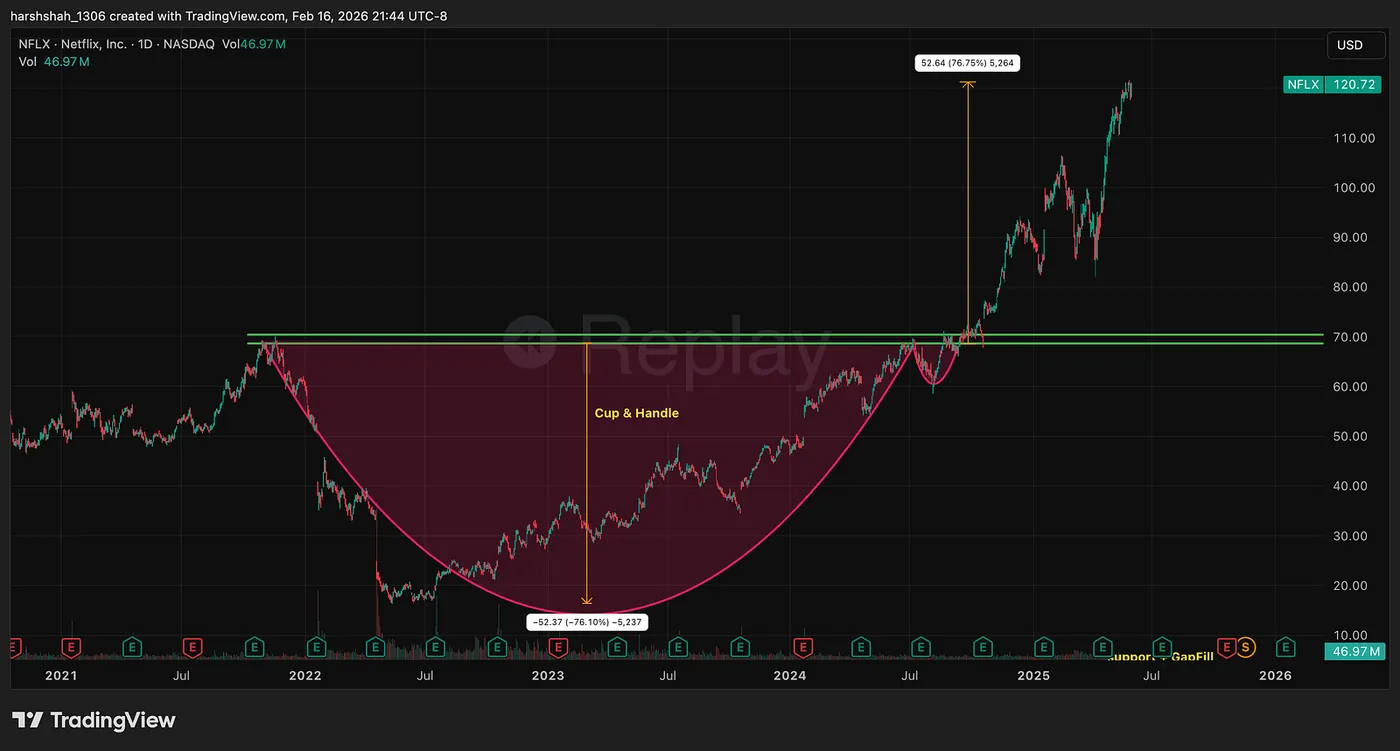
Price surged, the neckline flipped from resistance into support, and the stock delivered roughly a 75% move — almost perfectly matching the measured Cup & Handle projection.
This is one of those moments where technical structure works beautifully.
But the story doesn’t end there.
Fast Forward to Today — February 2026
Netflix has now fallen sharply and is retracing back toward that same neckline zone, which also aligns with a key support level and an unfilled gap.
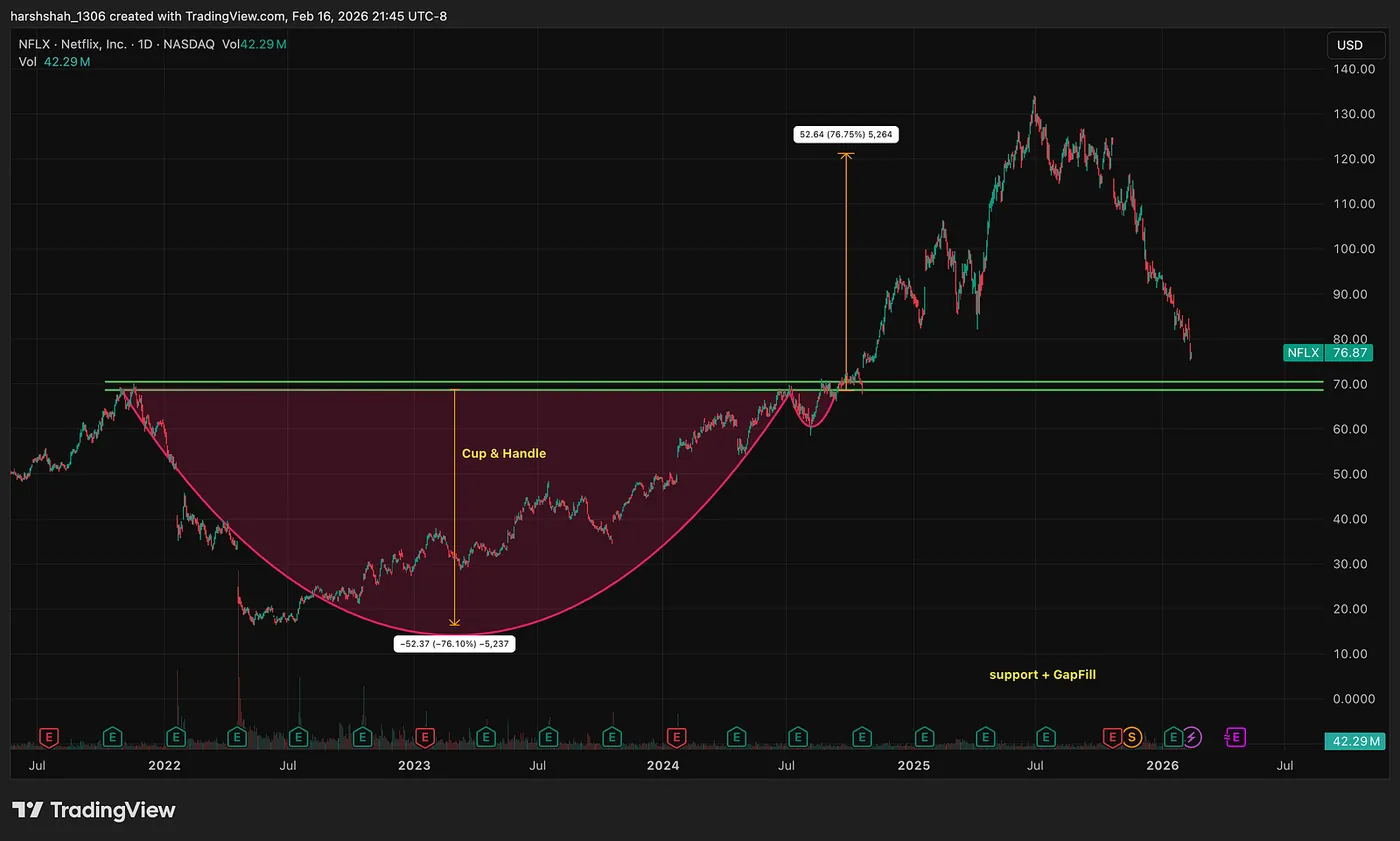
And here’s the psychological “wow” moment.
Think about this:
If you missed buying Netflix around $65–$70 during the original breakout phase…
Would you be interested if price returned to that same area today?
Most investors would.
That’s because prior resistance zones often become future demand zones — not because lines have magic power, but because human psychology repeats.
Investors who missed the first move wait for a second chance.
And markets tend to provide those opportunities.
Want to Follow My Chart Setups for Free?
If you found this analysis helpful and want to stay updated on similar opportunities, I regularly share chart setups with key levels and insights on my website.
You can explore the full Netflix setup here:
👉 https://datadriveninvesting.io/setup/us/NFLX-2026-02-12
I post new charts frequently, and you can sign up for free alerts to get notified whenever I publish a new setup.
The goal is simple — help you track high-quality opportunities without the noise.
Join here: 👉 https://datadriveninvesting.io
Final Thoughts
I’m not predicting that Netflix will bottom here.
But the chart is approaching a zone where:
- Historical demand previously appeared
- Structural support exists
- Risk-reward may begin improving
- Sentiment is far weaker than before
That combination is what gets my attention.
The goal isn’t to catch the exact bottom.
The goal is to identify moments where probabilities start shifting in your favor.
Right now, Netflix is moving closer to one of those moments.
I’ll be watching.