Understanding the 200 EMA as Support
Netflix Bounced 30% Here — Now Microsoft is Sitting at the Exact Same Level.
By Harsh Shah · Updated
Disclaimer: This content is for educational purposes only and should not be considered financial advice.
Technical analysis keeps amazing me.
Just when you think markets are random, a chart shows you something that feels almost too precise to ignore.
Take Netflix recently.
The stock dropped hard and landed exactly near $76 — a zone where two powerful factors aligned:
• 200-Week EMA support
• Gap fill level
What happened next?
Price bounced nearly 30% from there.
But the story doesn’t end there.
When the rally pushed higher, it ran straight into another key level — the 200-Day EMA near $99.
And guess what?
Price got rejected almost exactly there.
Support at the 200-week EMA.
Resistance at the 200-day EMA.
It’s moments like this that make you step back and say:
“Wow… the market really does respect these levels.”
If you spend enough time looking at charts, you’ll start noticing something interesting.
Today I want to explain what the EMA actually is, why the 200 EMA matters so much, and why the 200-week EMA can be even more powerful.
First — What Is an EMA?
EMA stands for Exponential Moving Average.
It is simply an average of prices over time, but with one key difference:
It gives more importance to recent prices.
This makes it more responsive to what the market is doing right now.
This is different from a traditional Moving Average (MA).
A standard moving average gives equal weight to all prices.
So in simple terms:
Moving Average (MA)
All past prices are treated equally.
Exponential Moving Average (EMA)
Recent prices matter more.
Because markets change quickly, EMAs react faster to trend shifts, which is why many traders prefer them.
A Simple Example of EMA
Let’s imagine a simple example.
Suppose a stock has the following prices over five days:
Day 1 → $100
Day 2 → $102
Day 3 → $105
Day 4 → $110
Day 5 → $115
A regular moving average treats all five days equally.
But the EMA gives more weight to the recent prices, especially $110 and $115.
Why?
Because recent price tells us more about the current direction of the market.
So if price suddenly starts rising fast, the EMA adjusts quicker than a normal moving average.
This makes EMAs extremely useful for tracking momentum and trend strength.
Why the 200 Day EMA Matters
The 200-day EMA represents roughly a year of trading activity.
That means it reflects:
• Institutional positioning
• Long-term investor sentiment
• Market cycles
• Trend health
Because of that, the 200 EMA becomes a natural decision point.
Why the 200 Weekly EMA Is Even More Powerful
If the 200-day EMA is important, the 200-week EMA can be even more powerful.
Why?
Because it represents nearly four years of market history.
Think about what that includes:
• Entire market cycles
• Multiple earnings cycles
• Institutional accumulation phases
• Major macro events
So when price reaches the 200-week EMA, it often becomes a major long-term support level.
Some of the biggest bounces in the market happen exactly here.
Many long-term investors and funds look at this level as a deep value zone.
That’s why when price approaches the 200-week EMA, markets often experience very strong reactions.
Sometimes huge bounces.
Sometimes critical breakdowns.
But rarely nothing.
What Often Happens Around the 200 EMA
Over time, I’ve noticed two very common behaviors.
Scenario 1 — Price Bounces
When a strong stock pulls back to the 200 EMA, long-term buyers often step in.
This creates a bounce.
Many strong trends continue exactly this way — pullback → 200 EMA → continuation.
Scenario 2 — Price Breaks Down
Sometimes price breaks below the 200 EMA.
This often signals that momentum is weakening.
When that happens, downside moves can accelerate as investors start reducing exposure.
When the 200 EMA Aligns With Other Factors
The 200 EMA becomes even more powerful when it lines up with other technical signals.
For example:
• Trendline support
• Horizontal support zones
• Gap fills
• Parallel channels
When multiple signals align, we call it confluence.
And confluence is where strong price reactions often happen.
A Perfect EMA Reaction: Netflix at $76
Below, I’ve shown a split view of the chart.
On the left is the daily chart, and on the right is the weekly chart.
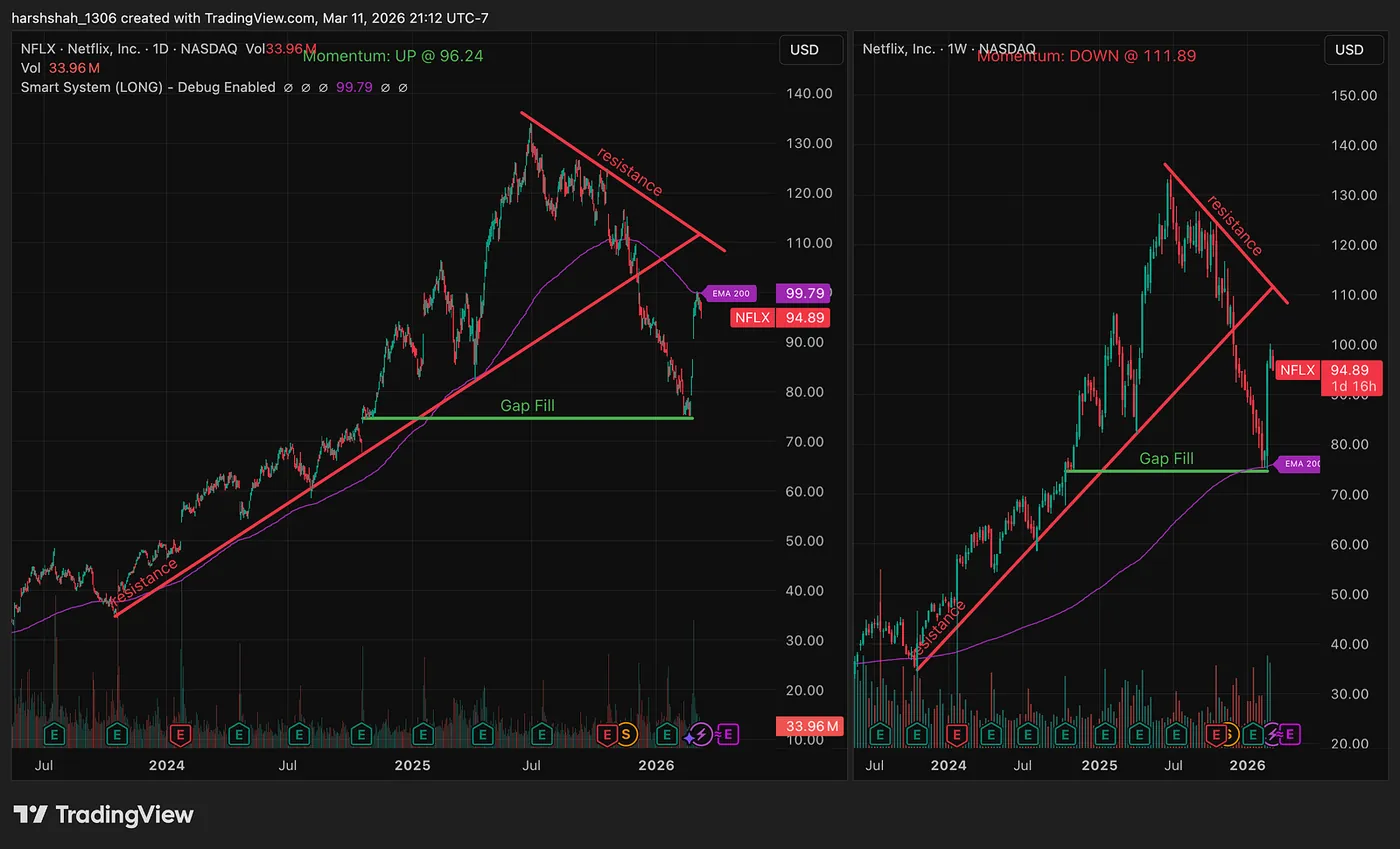
When Netflix dropped to $76, something very interesting happened.
On the daily chart, price landed right into a gap-fill zone.
At the same time, on the weekly chart, it touched the 200-week EMA.
Two powerful support factors aligned at the same level.
And what happened next?
Support held perfectly.
From that zone, the stock bounced nearly 30%.
But the market wasn’t done teaching us a lesson.
As the rally pushed higher, price ran straight into another major level — the 200-day EMA.
And right near $99, the rally got rejected.
Support at the 200-week EMA.
Resistance at the 200-day EMA.
Honestly, moments like this are mind-blowing — and they show why these levels matter so much in technical analysis.
MSFT sitting at 200-week EMA + Gap Fill zone
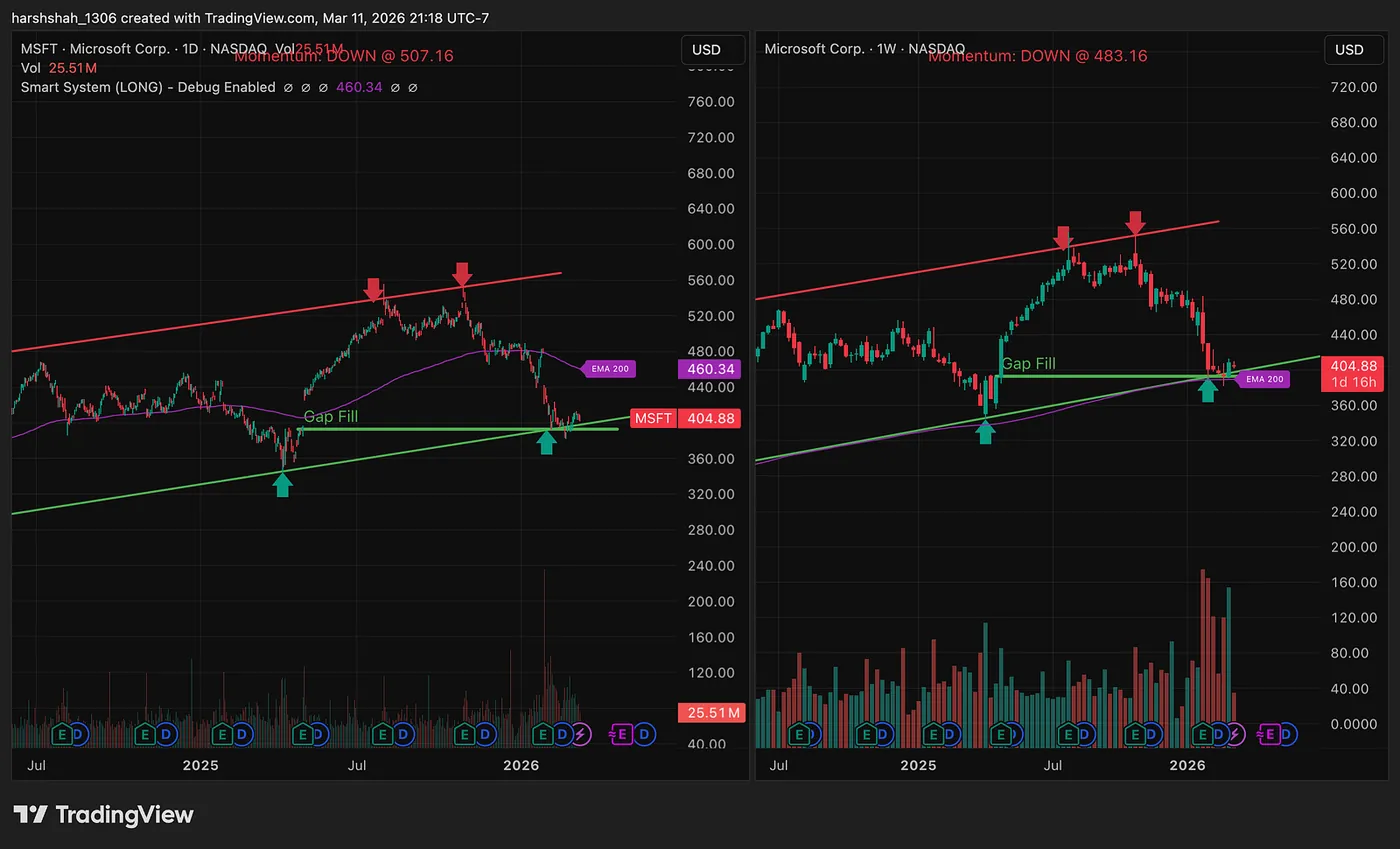
Now do you see what I’m talking about?
Microsoft is sitting right at the 200-week EMA, very similar to what Netflix did earlier.
And it’s not just one factor.
This level also aligns with a major support zone and a gap-fill area.
When multiple signals line up like this, it creates a high-importance zone where price often reacts.
Now the question is simple:
Will Microsoft bounce like Netflix did?
Time will tell!
Final Thoughts
One thing I’ve learned over the years is this:
Technical analysis is always about probabilities.
It doesn’t predict the future.
What it does is help you stay rational, focus on the data, and act when the odds are in your favor.
Levels like the 200 EMA simply highlight where the most important battles between buyers and sellers happen.
And when you start paying attention to those levels, the market begins to make a lot more sense.
Sometimes the most powerful tools in trading aren’t complicated.
They’re the ones everyone is watching.
Learn Technical Analysis (Simple & Structured)
All technical analysis concepts are explained in a simple way in my blogs. Explore them here:
datadriveninvesting.io/blogs
If you’re looking for structured learning, you can sign up for my TA course here:
datadriveninvesting.io/course