Understanding the Bearish Engulfing Candle
Bitcoin’s ~10% crash and Tesla’s slide started with One Candle — The Bearish Engulfing Pattern
By Harsh Shah · Updated
Disclaimer: This information is for educational purposes only and should not be considered financial advice.
Have you ever watched a stock rally strongly — only to suddenly roll over and drop like a stone?
That sharp shift in momentum often starts with one simple pattern: the Bearish Engulfing Candle.
Let’s break it down.
The Fight Between Mr. Bob and Mr. John
For weeks, Mr. Bob and the bulls had been running wild with Stock X. They triumphantly pushed the price up from $50 to a confident $90, celebrating their victory at every new high.
Thinking they were unstoppable, they went in for the final push: a glorious 10% surge that sent the stock soaring from $90 to $99 in a single day. The bulls were euphoric. It looked like a breakout to the moon.
But they made one critical mistake. They pushed the price right into an ambush. Mr. John and an army of patient bears were waiting at the $99 level.
The next day, as the price briefly gapped up to $101, they launched their counter-attack.
A single, mammoth red candle erupted on the chart, crashing the price all the way down to $87.
In one spectacular move, the bears didn’t just halt the rally — they completely reversed the sentiment, trapping the bulls and announcing that a new king was in town.
What Is a Bearish Engulfing Candle?
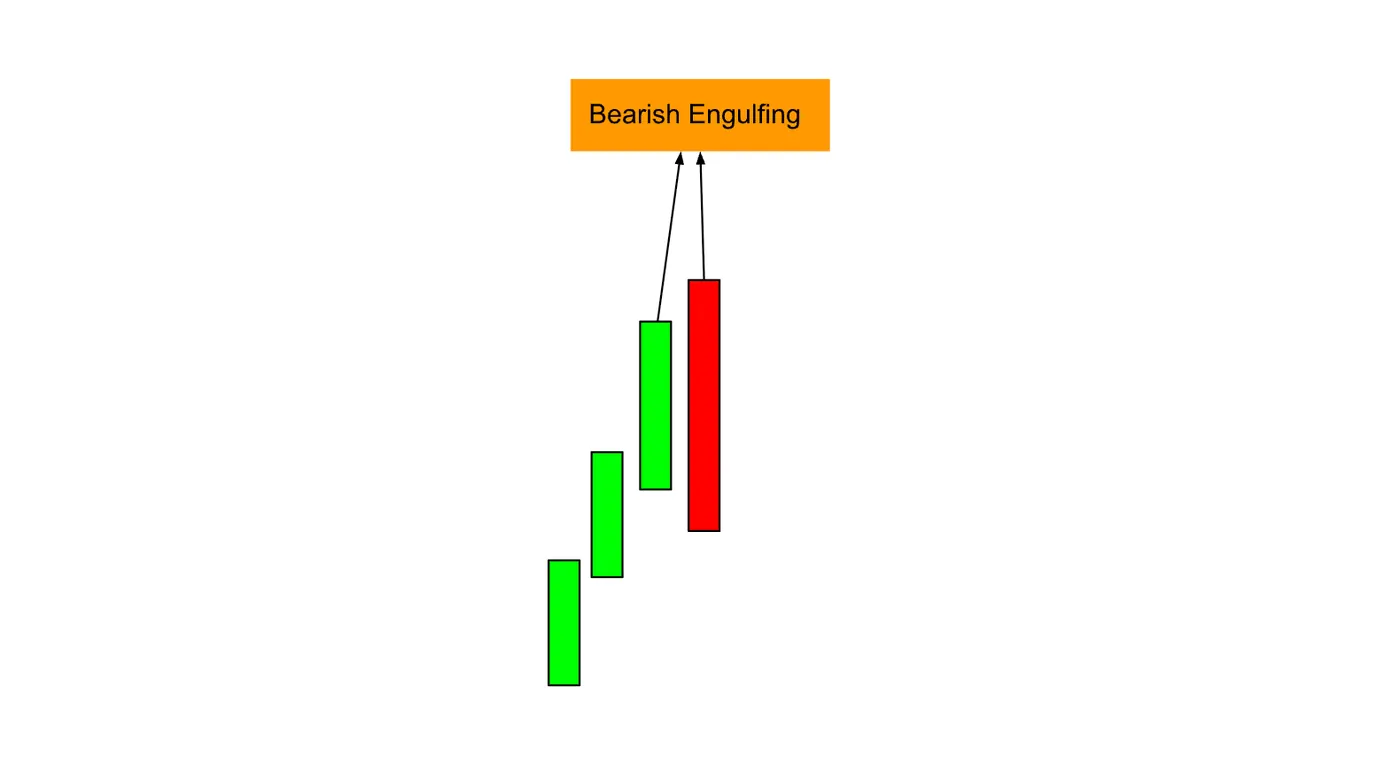
A Bearish Engulfing Candle is a two-candle reversal pattern that appears after an uptrend.
Here’s how it forms:
- Day 1 (Bullish Candle): The stock closes higher — buyers remain in control.
- Day 2 (Bearish Candle): The next day opens above the prior close (showing initial bullishness) but then sellers take over, pushing the price below the previous day’s open.
That means the second candle’s body completely engulfs the first candle’s body — hence the name.
It’s a visual cue that buying pressure has been overwhelmed by selling momentum.
What It Tells You
This pattern signals a potential bearish reversal.
It suggests that:
- Buyers tried to push the price higher but failed.
- Sellers stepped in aggressively.
- Market sentiment may be shifting from bullish to bearish.
It’s especially powerful when it appears:
- Near a major resistance zone
- After a strong uptrend
- With higher-than-average volume
🔍 How to Identify It on a Chart
To spot a Bearish Engulfing Candle, look for:
- Two candles at or near the end of an uptrend.
- The second candle should:
- Open above the previous day’s close.
- Close below the previous day’s open.
- The second candle’s body should be large and decisive — ideally a strong red candle.
(Imagine a small green candle followed by a big red one that completely wraps around it.)
How Traders Use It
Here’s how traders often act on it:
- Entry: When the next candle confirms by trading below the Bearish Engulfing Candle’s close.
- Stop-loss: Just above the high of the engulfing candle.
- Target: Near previous support levels or based on a risk–reward setup (e.g., 1:2).
For added confirmation, traders often check for:
a) RSI rolling down from overbought zones.
b) Increased volume during the engulfing candle.
c) Alignment with resistance levels or moving averages.
⚠️ A Word of Caution:
Not every Bearish Engulfing Candle triggers a major drop.
It’s less effective in choppy or sideways markets.
Always combine it with broader technical context — trendlines, moving averages, or volume — before acting.
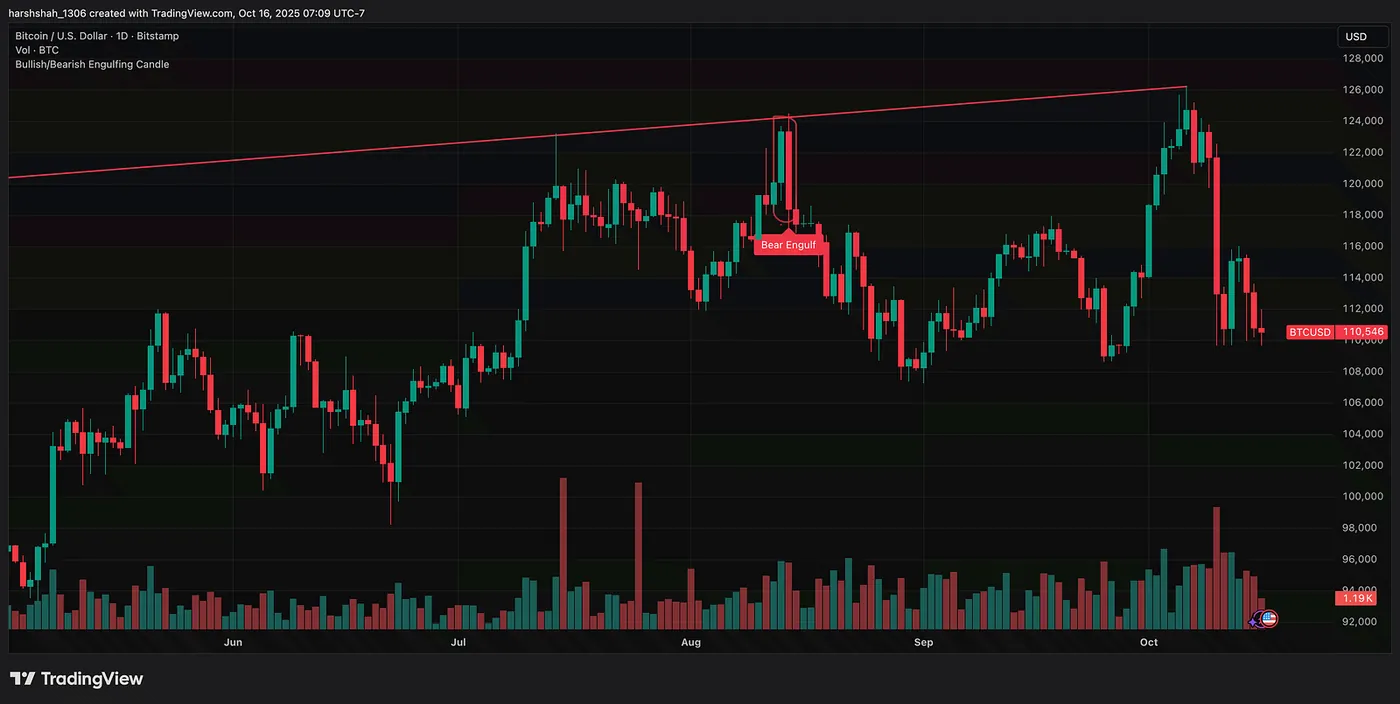
Bitcoin — Case Study
A textbook confluence of bearish signals appeared as Bitcoin tested its long-term resistance.
The formation of a bearish engulfing candle, validated by a surge in volume, provided a clear indication for the ~10% pullback that followed.
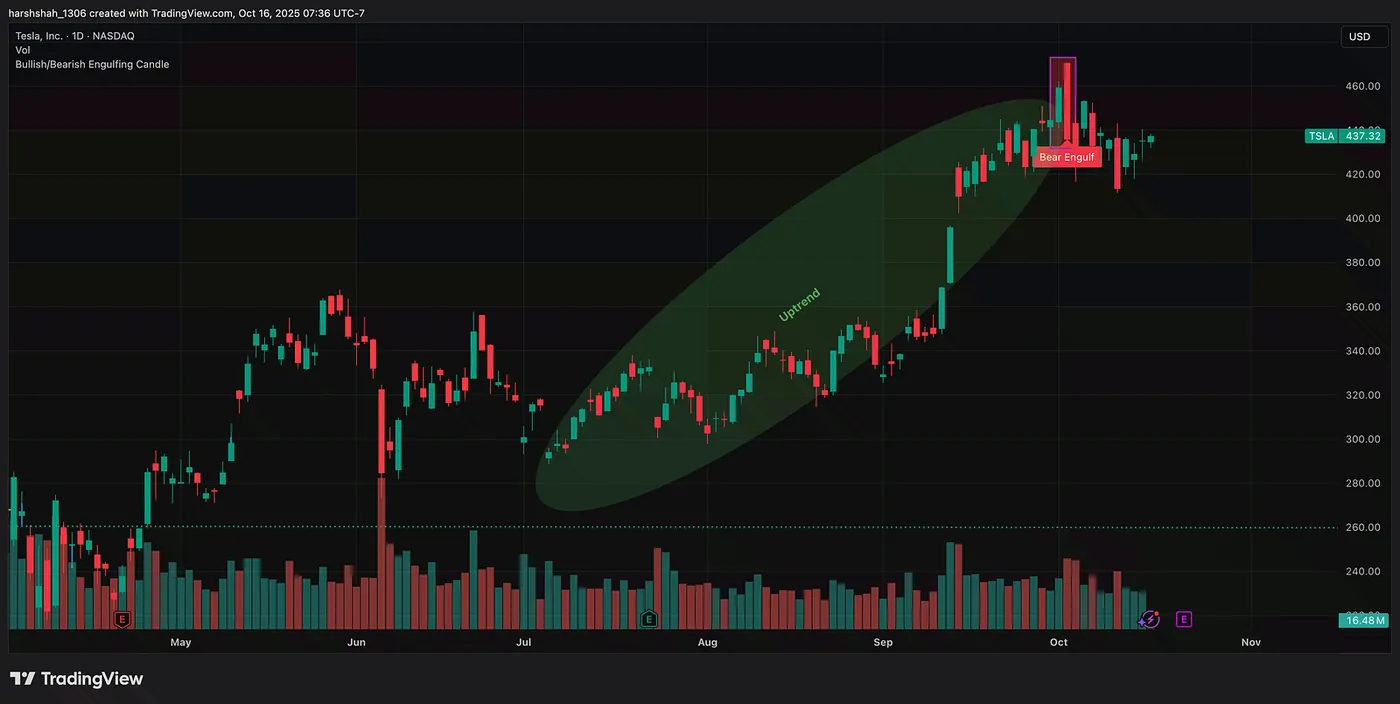
TSLA — Bearish Engulfing in Play
After a sustained rally, TSLA is showing signs of a potential reversal. A bearish engulfing candle has formed at the recent peak of ~$470, coinciding with a double top.
The high volume during this period suggests strong selling pressure and adds weight to the bearish outlook.
🪄 Final Thoughts
The Bearish Engulfing Candle is one of the most visually clear reversal signs on a chart.
It tells you when momentum has shifted — when the bulls’ strength fades, and sellers quietly take over.
Used in context — especially near major resistance levels — it’s a valuable early warning sign that a trend may be losing steam.
I’m creating a full technical analysis series that breaks down chart patterns — from consolidations and wedges to breakouts and reversals — using real-world examples.