Understanding the Bottoming Tail
This Stock Has a 80%+ Chance of a Bounce — Here’s Why
By Harsh Shah · Updated
Disclaimer: This information is for educational purposes only and should not be considered financial advice.
I am going to reveal a stock that is flashing an 80%+ chance of a bounce, creating a high-probability opportunity.
This stock dropped a whopping 52% in 3 months, everyone around is scared. Knowing the bottom is impossible.
But at the same time, based on technical analysis, the stock is showing a 80%+ chance of a bounce and has created a high-probability setup for a rebound.
Did I take the trade? Absolutely — though always with a stop loss, in case the drop continues.
And that’s the point: my goal is to give you a framework so you can spot these setups yourself…
and pull the trigger with confidence, no hesitation.
Stacking the Odds — The Pillar of Technical Analysis
In Technical Analysis, layering multiple signals together boosts your odds of success.
With one indicator, the odds of success might be 60%, two indicators — 70%, add a third one — it jumps to 80%.
Since it is based on probability, nothing is ever guaranteed.
That’s why having a clear game plan before every trade is crucial — and sticking to it consistently.
Only then can you realistically target an 80% win rate, turning 8 out of 10 trades into successes.
Before we dive in the real world example, let’s explore a new concept — bottoming tail — and see how it boosted the probability for our setup.
What is a Bottoming Tail?
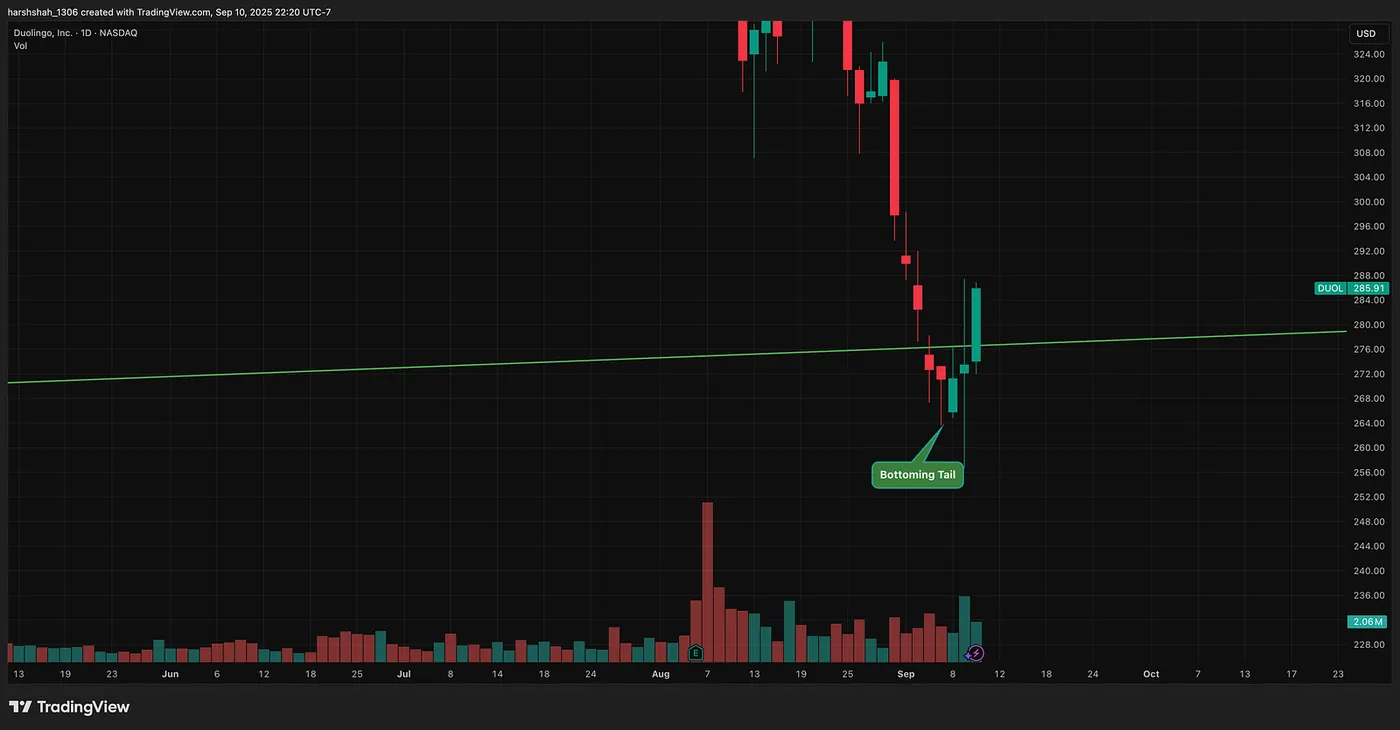
A Bottoming Tail forms when an stock sells off hard but then bounces back, closing near the top of the candle.
This shows that sellers tried to push the price down aggressively, but buyers regained control.
In short, panic sellers exit → smart buyers (often institutions) step in.
Key Characteristics of a Bottoming Tail
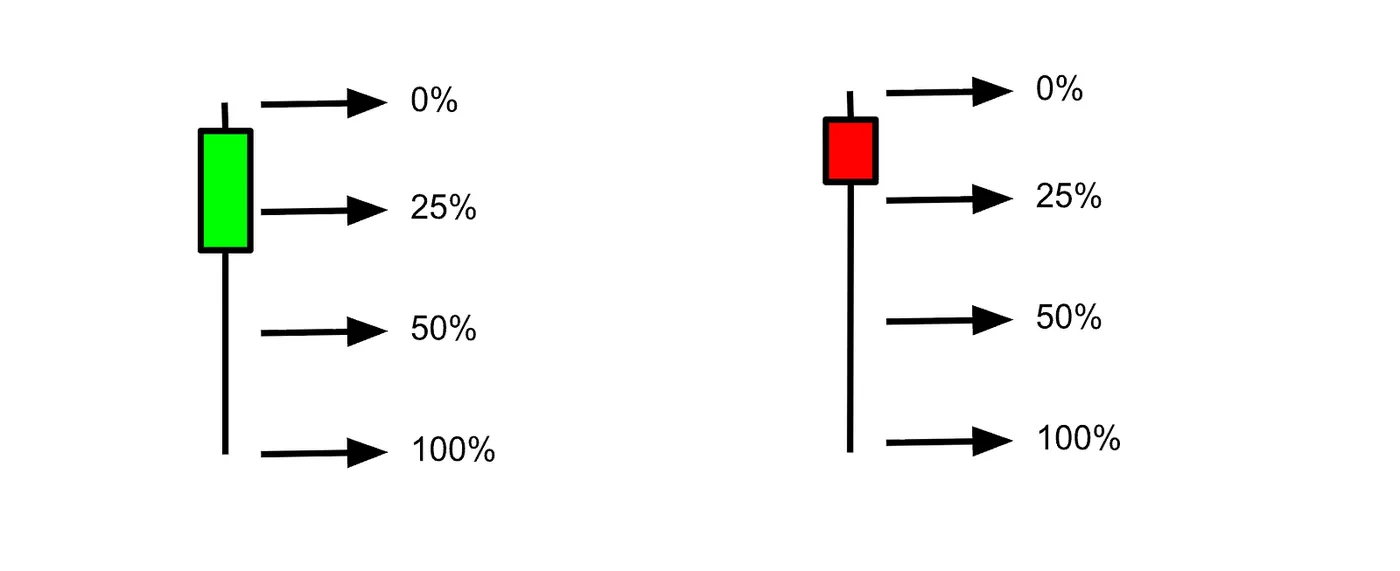
- Forms at or near a major pivot low (think: last 90 candles).
- The candle should be large in size — one of the largest in the past 30 candles.
- The tail (wick) is at least 50% of the total candle length.
- The body of the candle is in the upper 50%.
- The close is ideally in the top 25% of the entire candle.
This formation tells us that selling pressure is drying up and bullish momentum is likely to follow.
Does the Color Matter for the Bottoming Tail?
For a bottoming tail, the length of the tail (wick) is far more important than the candle’s color.
- If the candle closes green (bullish), it’s stronger because it shows buyers not only fought back but also pushed the price above the open.
- If the candle closes red (bearish), it still signals buying pressure, since the stock recovered from its lows — but it’s slightly weaker compared to a green close.
In short:
✅ Long bottoming tail = key signal.
✅ Green close = stronger reversal sign.
✅ Red close = still valid, but more cautious confirmation is needed.
The Psychology
- The tail shows sellers tried to push the stock down, but buyers were strong enough to fight back.
- It reflects a shift in control — from fear-driven selling to confident buying.
- That’s why traders see it as a potential sign of reversal: the panic may be over, and demand is stepping in.
How to Trade Bottoming Tails ?
Identifying these candles is only the first step. But execution is where traders succeed or fail.
For example, if the low of the bottoming tail is 10$, and the high is 20$, the smart trader will wait to enter at a retrace of 50% i.e. 15$.
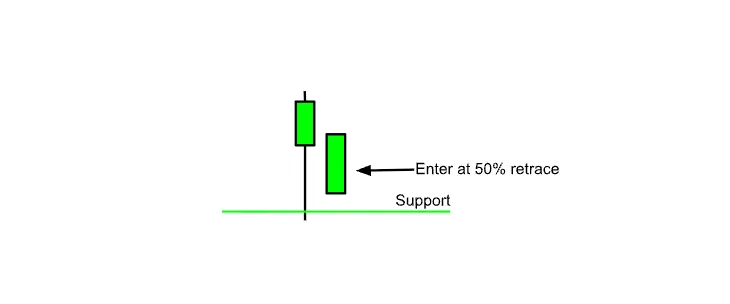
Some additional rules:
- Bottoming Tails → should form at support zones or lows.
- Always add at least one or two confirming factors to increase probability like support, volume spike, RSI divergence.
- For a Bottoming Tail (Bullish): Buy near the 50% retrace level.
Prices retrace 50% of the tail candle nearly 90% of the time. This retrace often gives the best entry point.
When Do They Fail?
Not every setup plays out. Knowing when your thesis is wrong is essential.
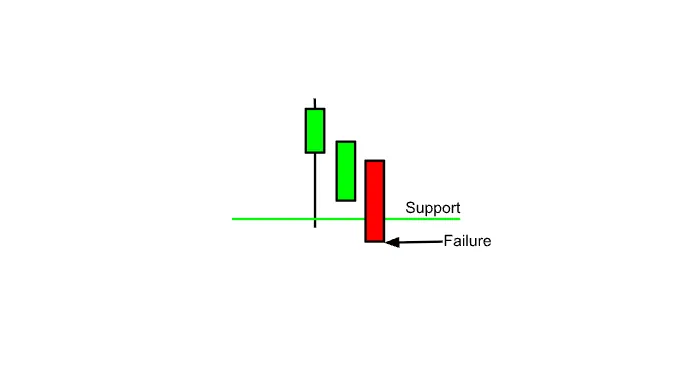
Bottoming Tail Failure: Any candle that closes below the low of the Bottoming Tail.
At this point, exit quickly — the pattern is no longer valid.
Example: If a bottoming tail forms with a low of $10 and a high of $20, a smart trader looks to enter around $15 (the 50% retracement level). The trade should be exited if any subsequent candle closes below the bottoming tail’s low of $10.
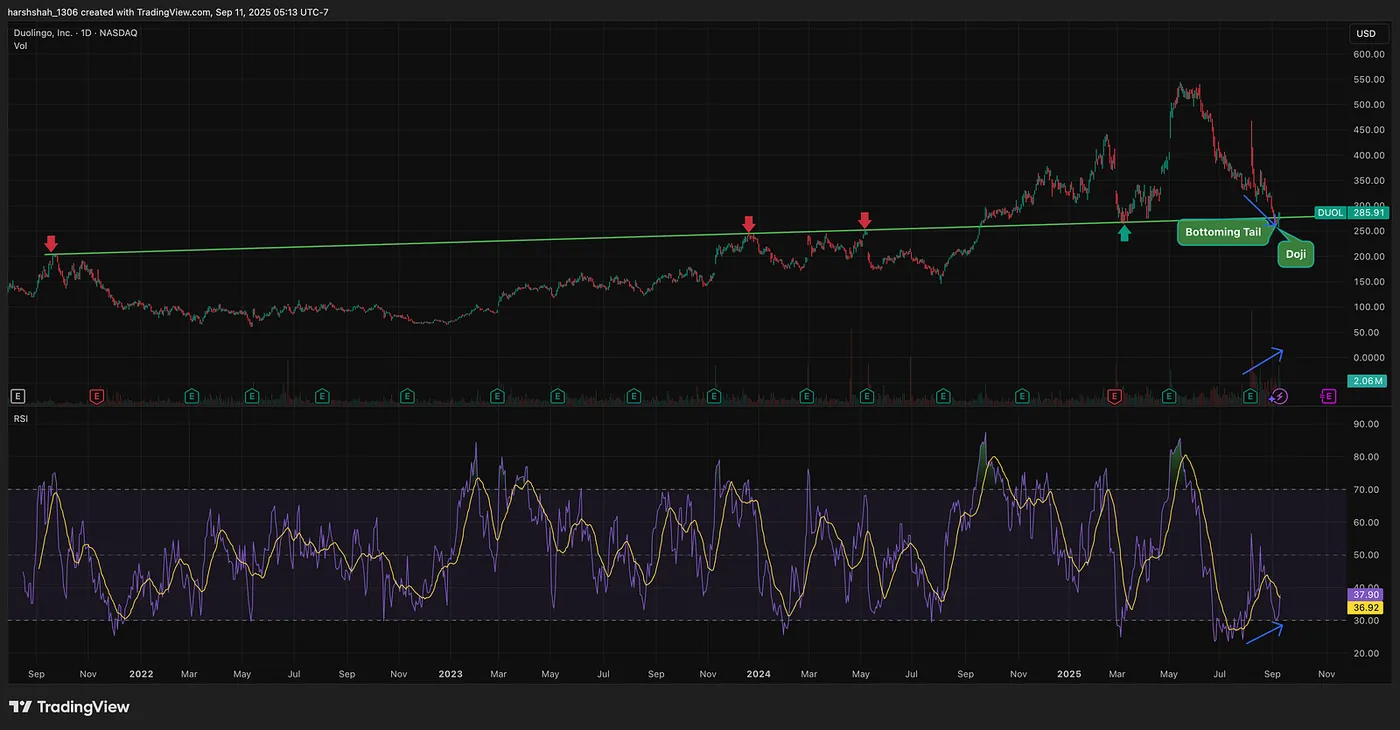
DUOL Chart — A high probability Setup.
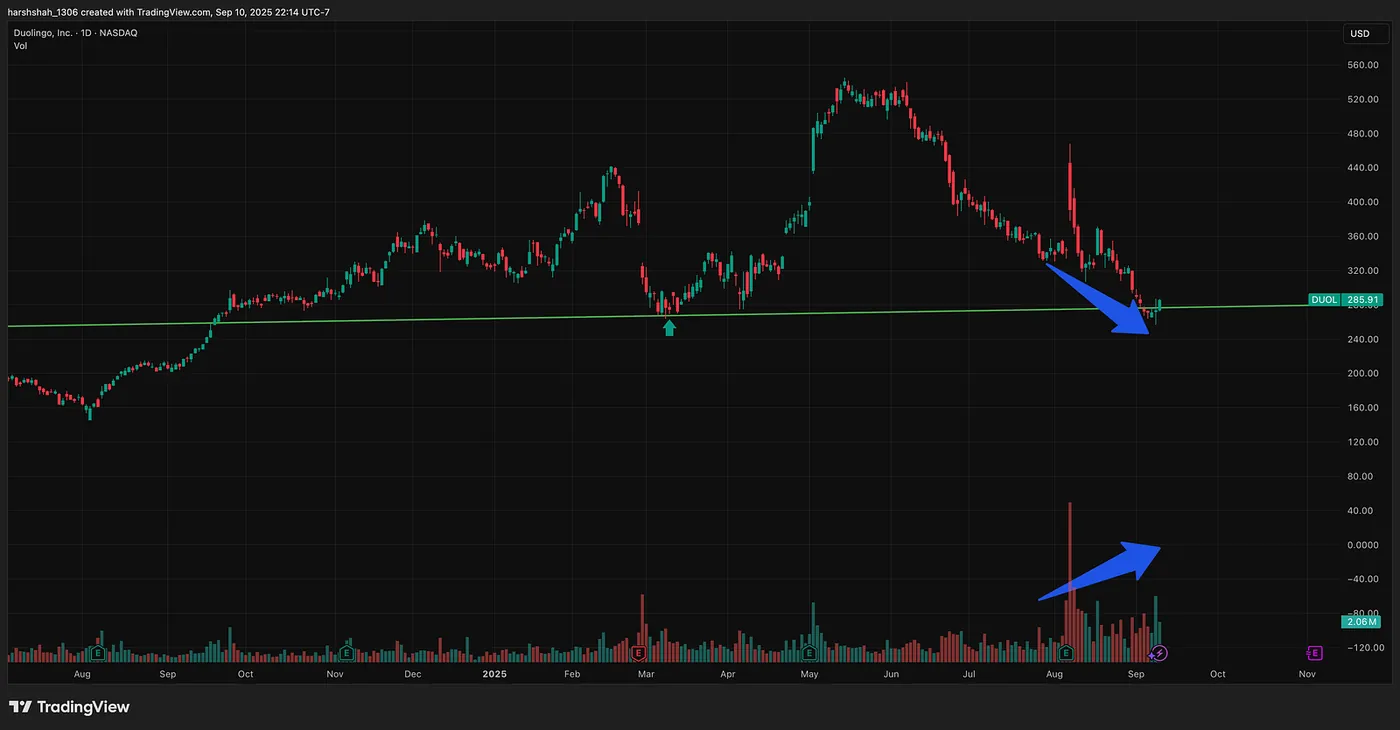
Factor 1: At a long term Support.
The price tried to sell off below support, but never confirmed.
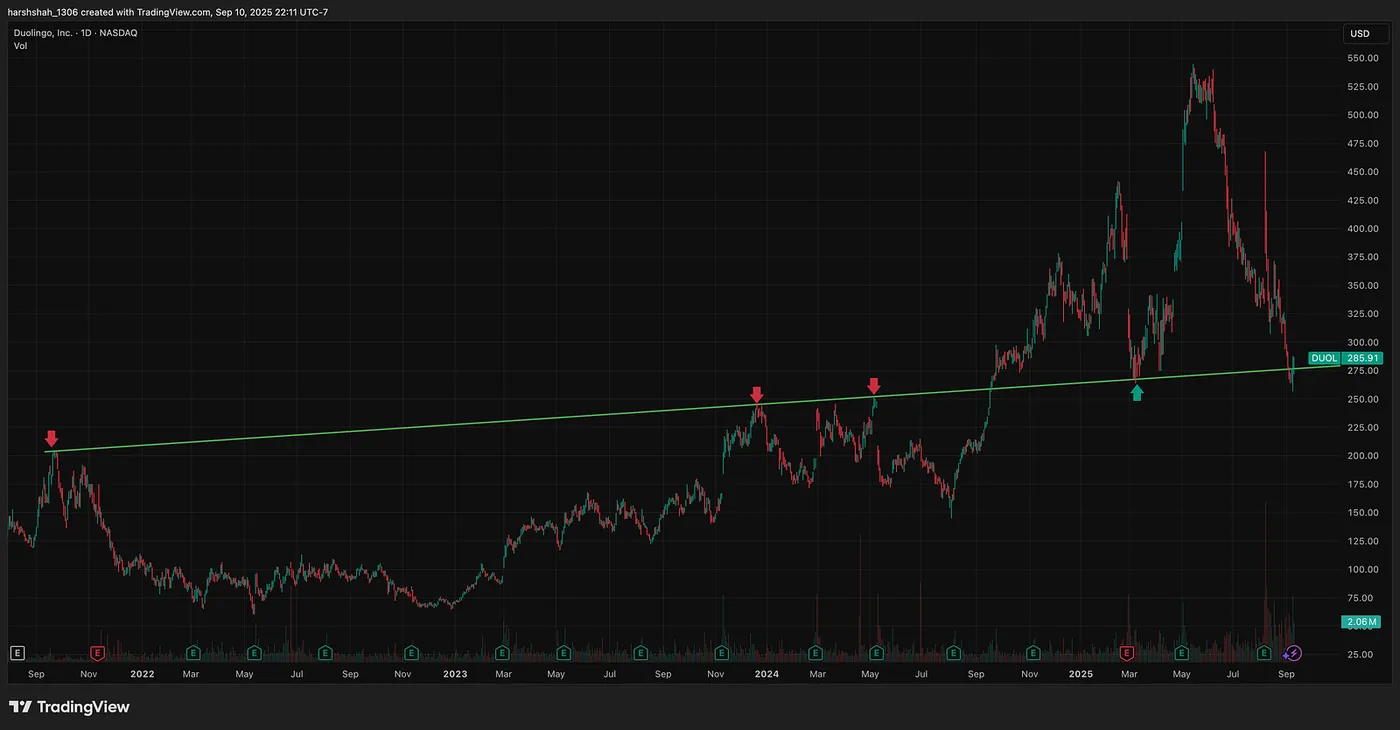
Factor 2: Volume Spike — Sign of Accumulation
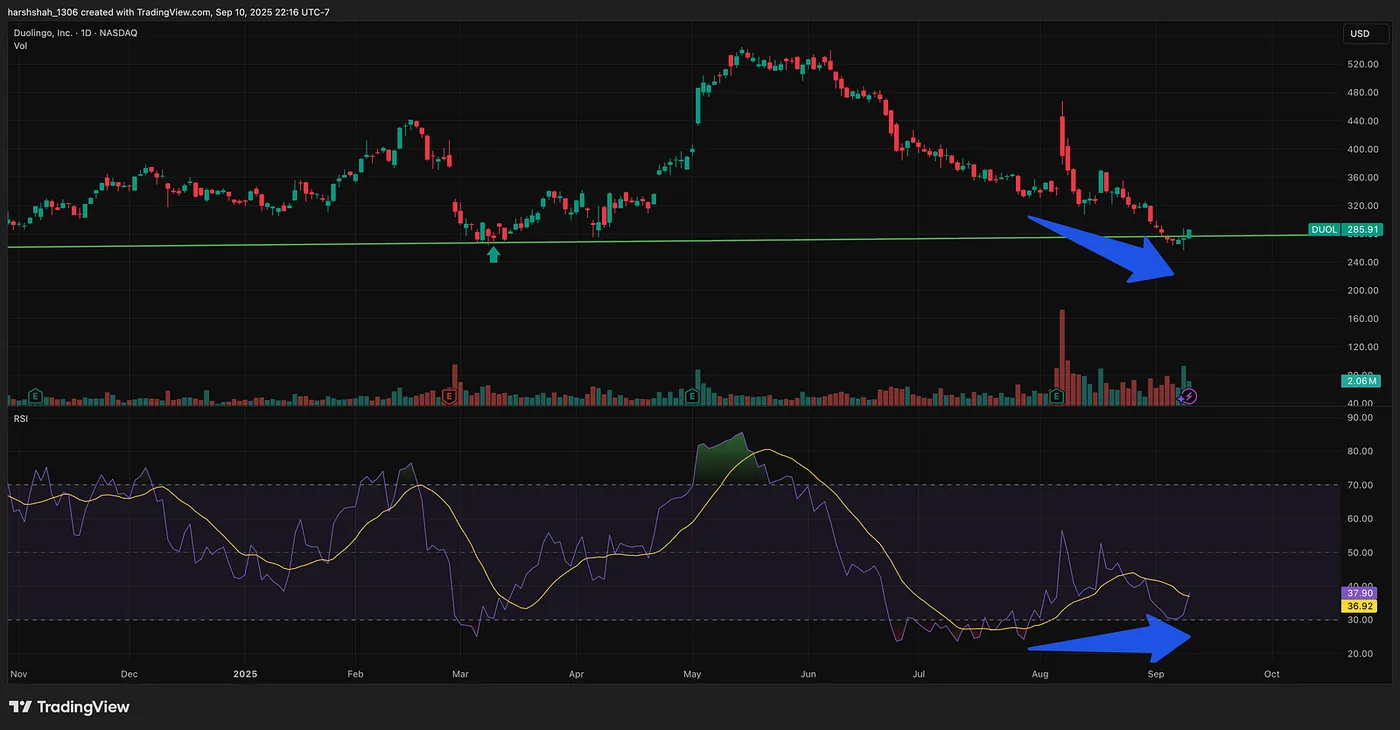
Factor 3: RSI Divergence
Factor 4: Bottoming Tail
Note: While this isn’t the strongest bottoming tail compared to the last 30 candles in terms of size, it still serves as a signal when considered alongside other factors.
Factor 5: Doji CandleI plan to cover this setup in one of my next blogs.
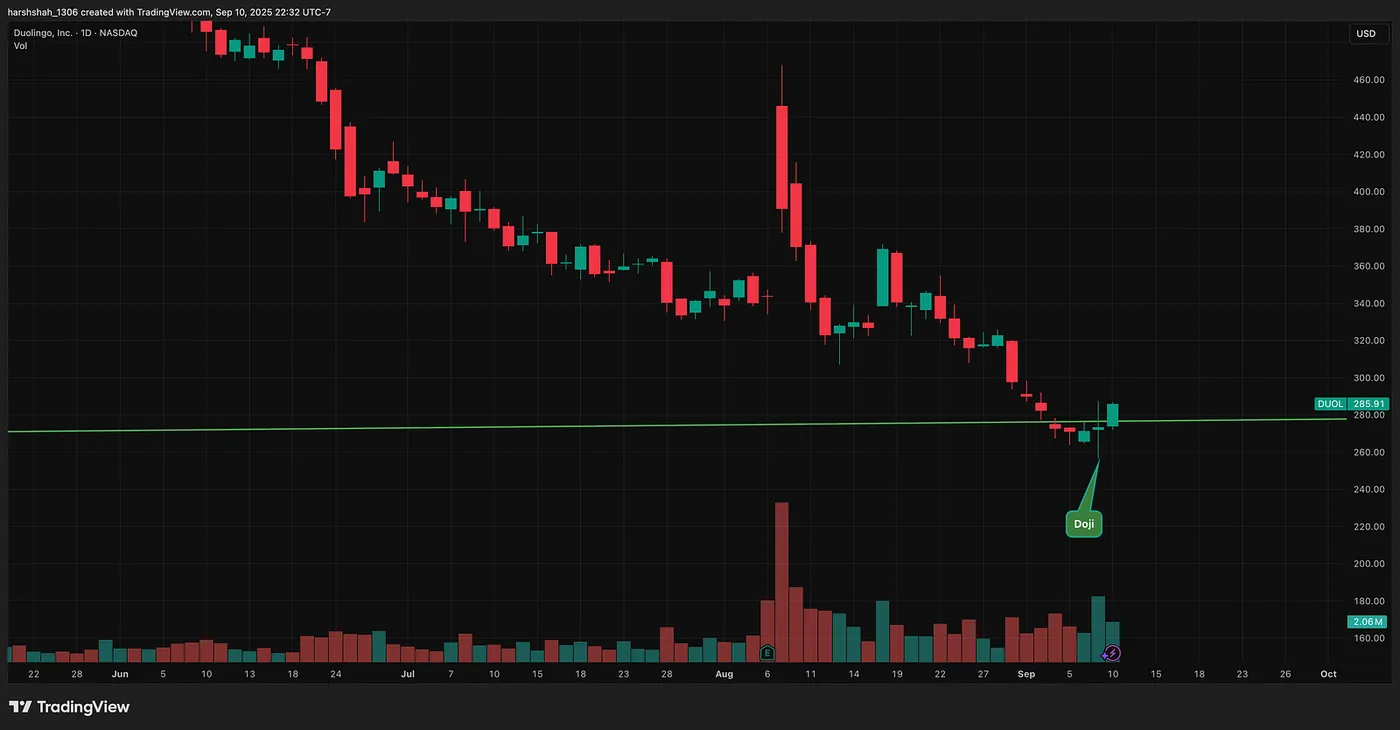
Combining all factors — a 80%+ success setup
How I traded:
Personally, I didn’t wait for the bottoming tail or Doji Candle.
I entered earlier, right when support broke (~272$), expecting a fakeout — based on a 3-factor setup: support, RSI divergence, and a volume spike.
My stop loss was set on any close below the low of the breakdown candle (~$267).
But later, the odds just got better w/ a bottoming tail and a Doji Candle
Better entry:Enter around the 50% retracement of the bottoming tail, near ~$268. The stop loss would be set on any close below the low of that bottoming tail.
I am riding this and will learn how it unfolds in the coming days!
Final Thoughts
Bottoming Tails are among the most powerful candlestick reversal patterns. They work because they reflect a clear shift in market psychology — From fear to accumulation.
Used correctly, especially with multiple indicators and the 50% retrace rule, these patterns can significantly improve your entry timing and risk management.