10 High-Probability Setups My AI Scanner Is Tracking Right Now
By Harsh Shah · Updated
Disclaimer:This is for educational purposes only. Not financial advice.
This isn’t a stock recommendation — it’s a proof of concept showing how AI can bridge the gap between finding opportunities and actually acting on them.
Every day, my scanner analyzes the entire U.S. stock market and surfaces setups that match my trading criteria. The goal was to build something intuitive enough that I don’t have to second-guess every chart. As a result, I’m now able to spot potential opportunities before they become obvious to the broader market.
Will every setup work? Of course not.
But trading isn’t about being right every time. It’s about finding enough high-probability setups so that the winners outweigh the losers over time.
Here are 10 setups currently on my watchlist.
Neckline Breakout Scanner
This scanner tracks stocks attempting to break above key resistance levels.
Under the hood, these setups can include:
Below are a few names currently setting up.
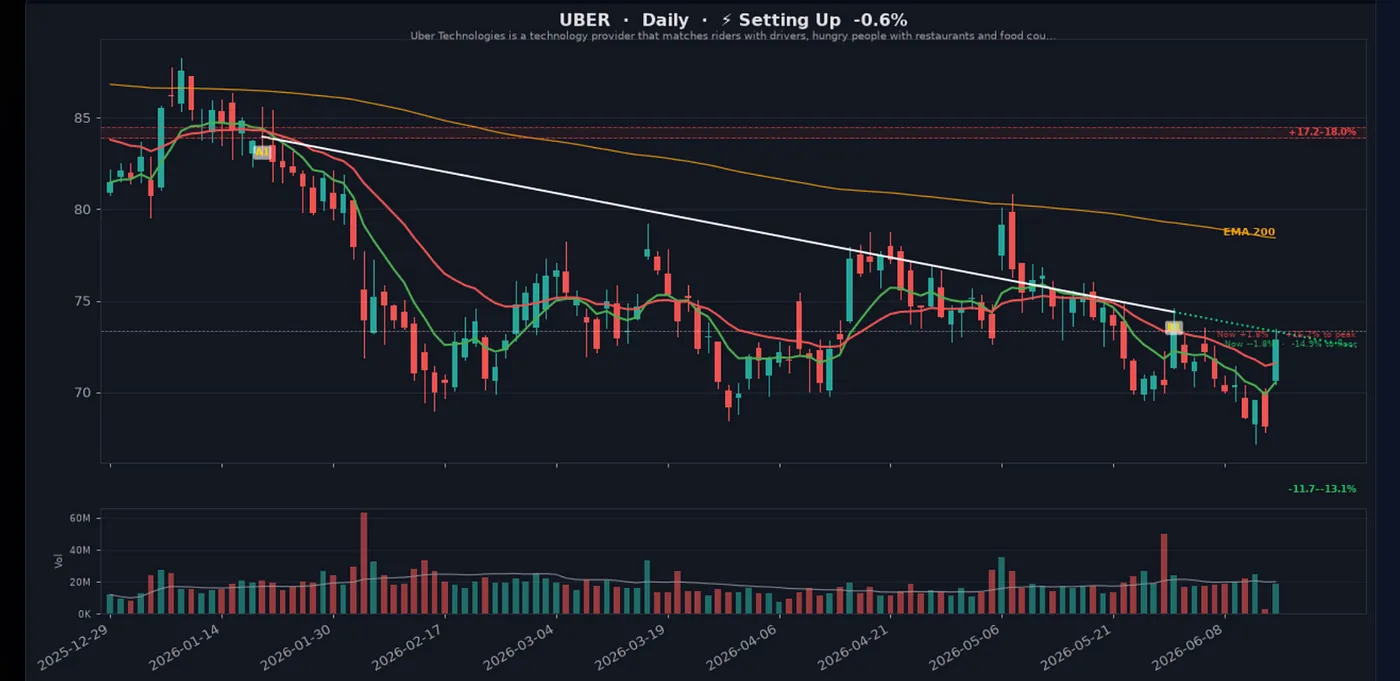
UBER
Attempting to break above a major resistance level after a prolonged consolidation.
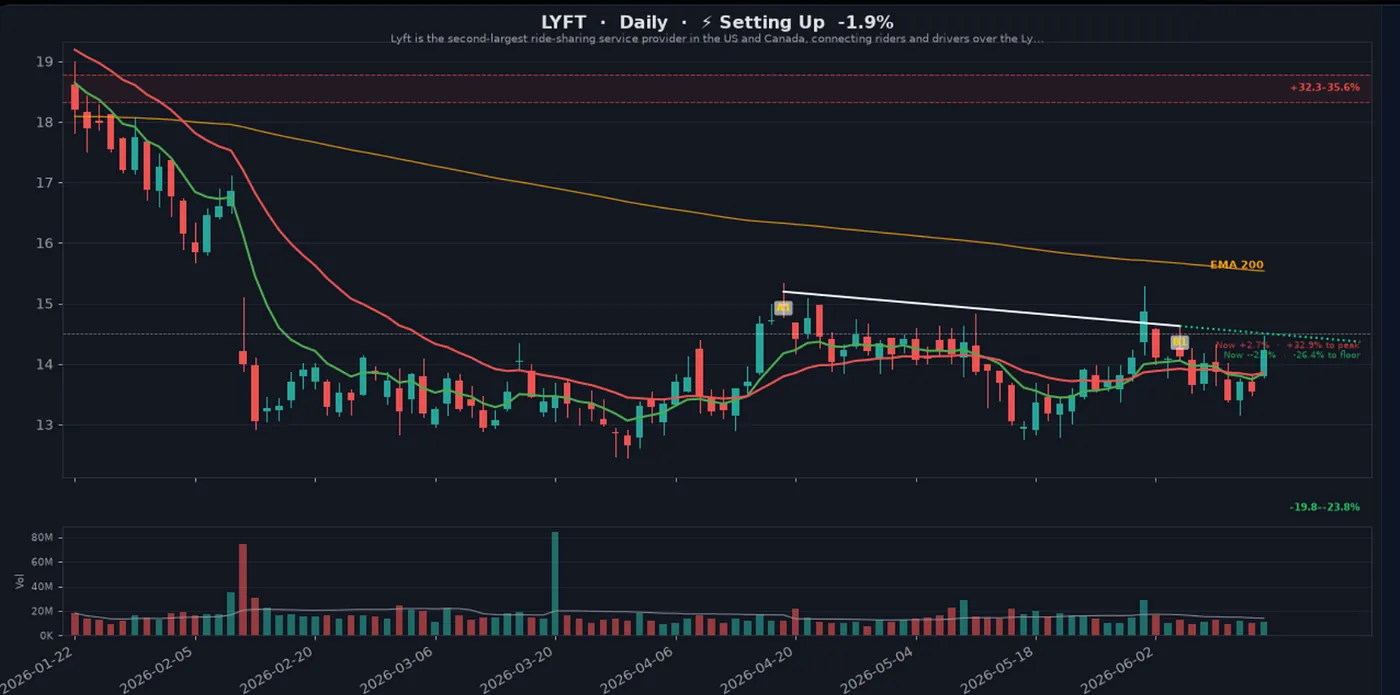
LYFT
A similar setup to UBER, showing strength as it approaches a potential breakout zone. Also, looks like a mini C&H or inverse H&S pattern.
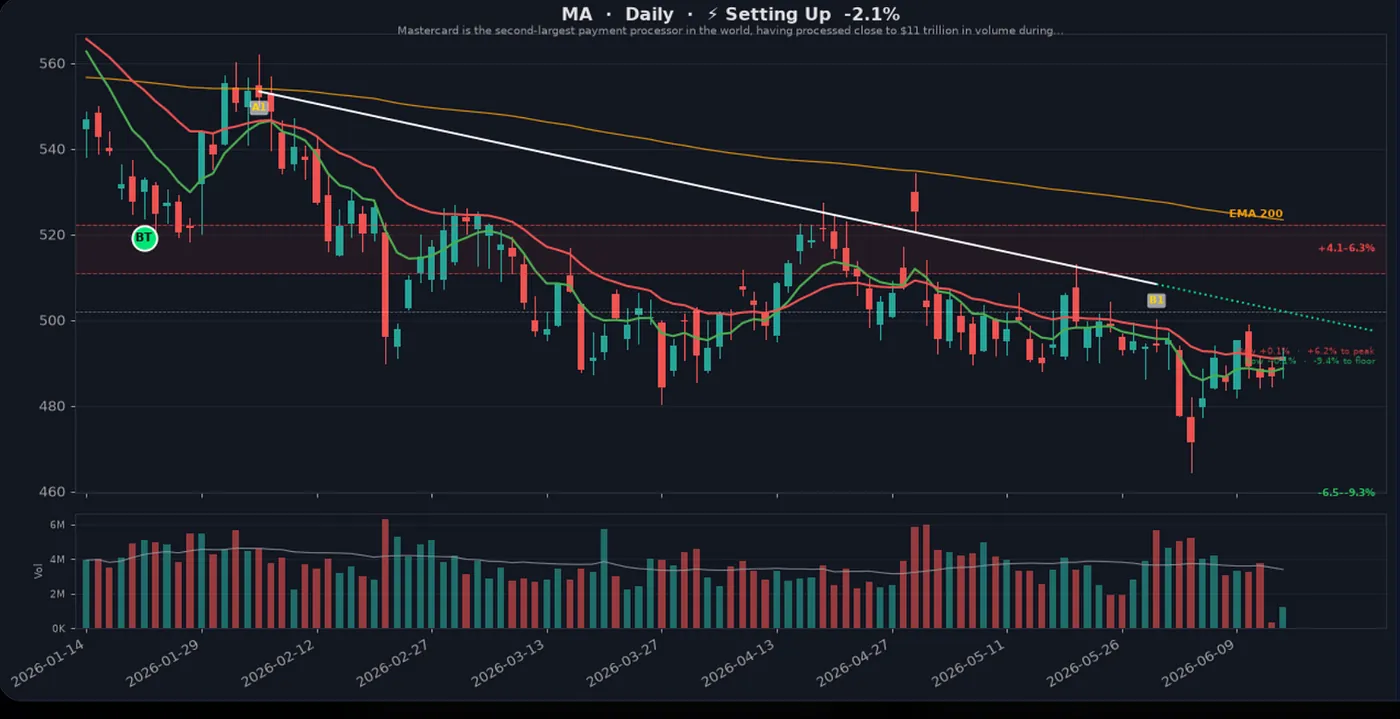
Mastercard (MA)
Consolidating tightly just below its neckline, often a sign of building momentum.
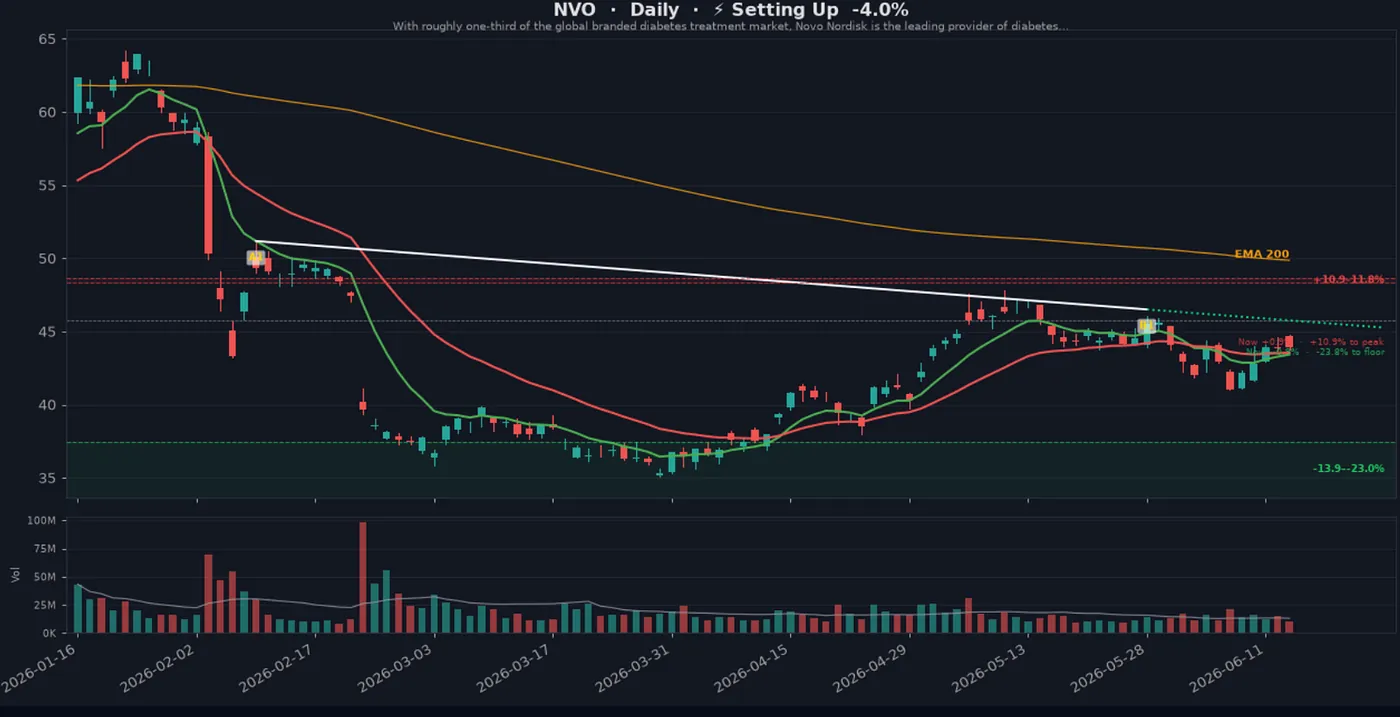
Novo Nordisk (NVO)
Has formed a Cup & Handle pattern and is currently waiting for a breakout confirmation.
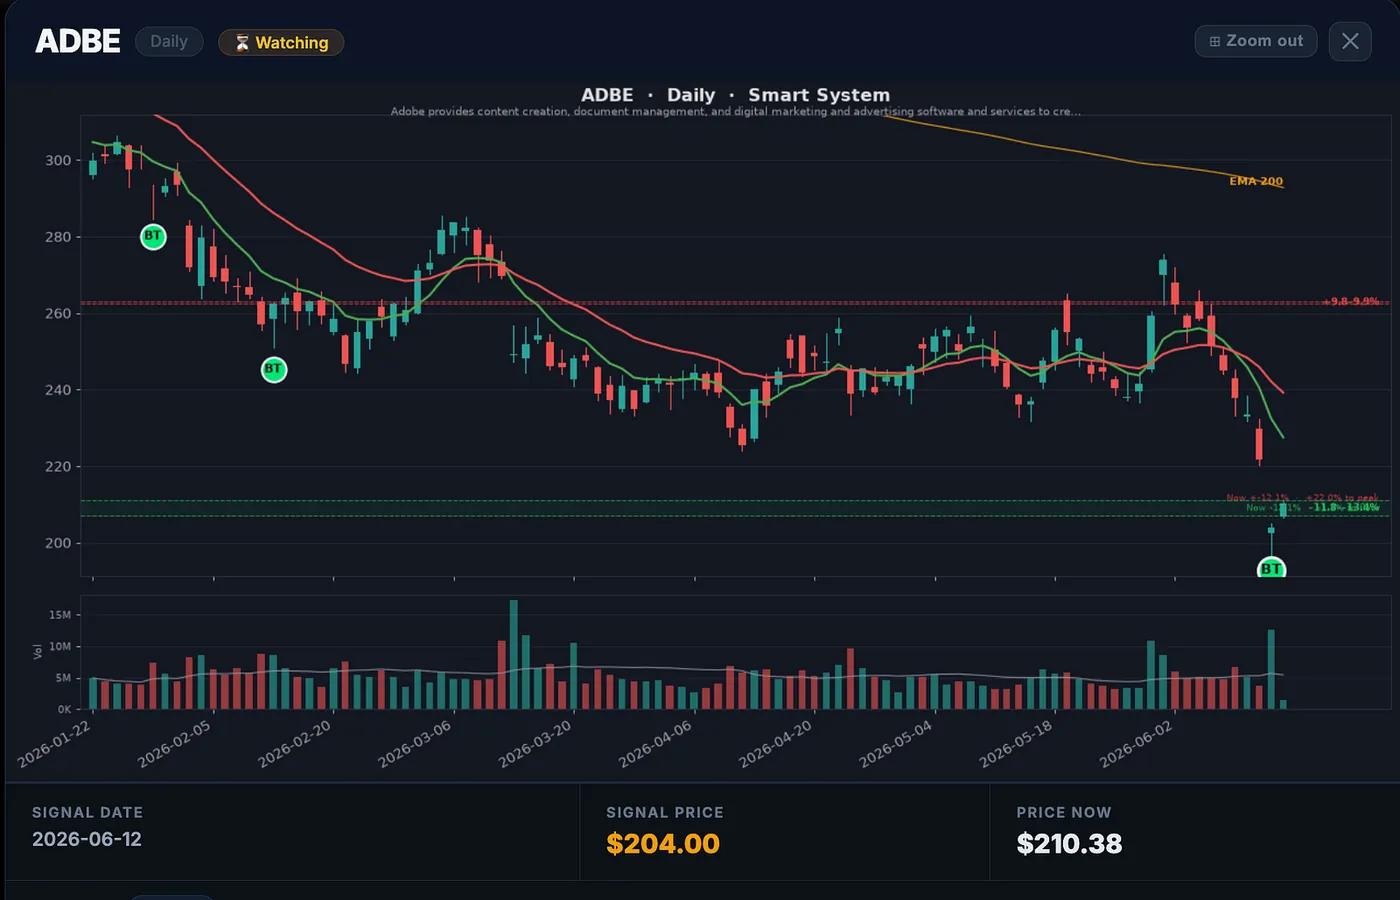
Bottoming Tail Scanner
This scanner looks for stocks that may have been heavily sold off and are beginning to recover.
A bottoming tail is characterized by a long lower wick, suggesting strong buying pressure stepped in after sellers pushed prices lower.
Adobe (ADBE)
Recently formed a bottoming tail following earnings, indicating potential accumulation.
Topping Tail Scanner
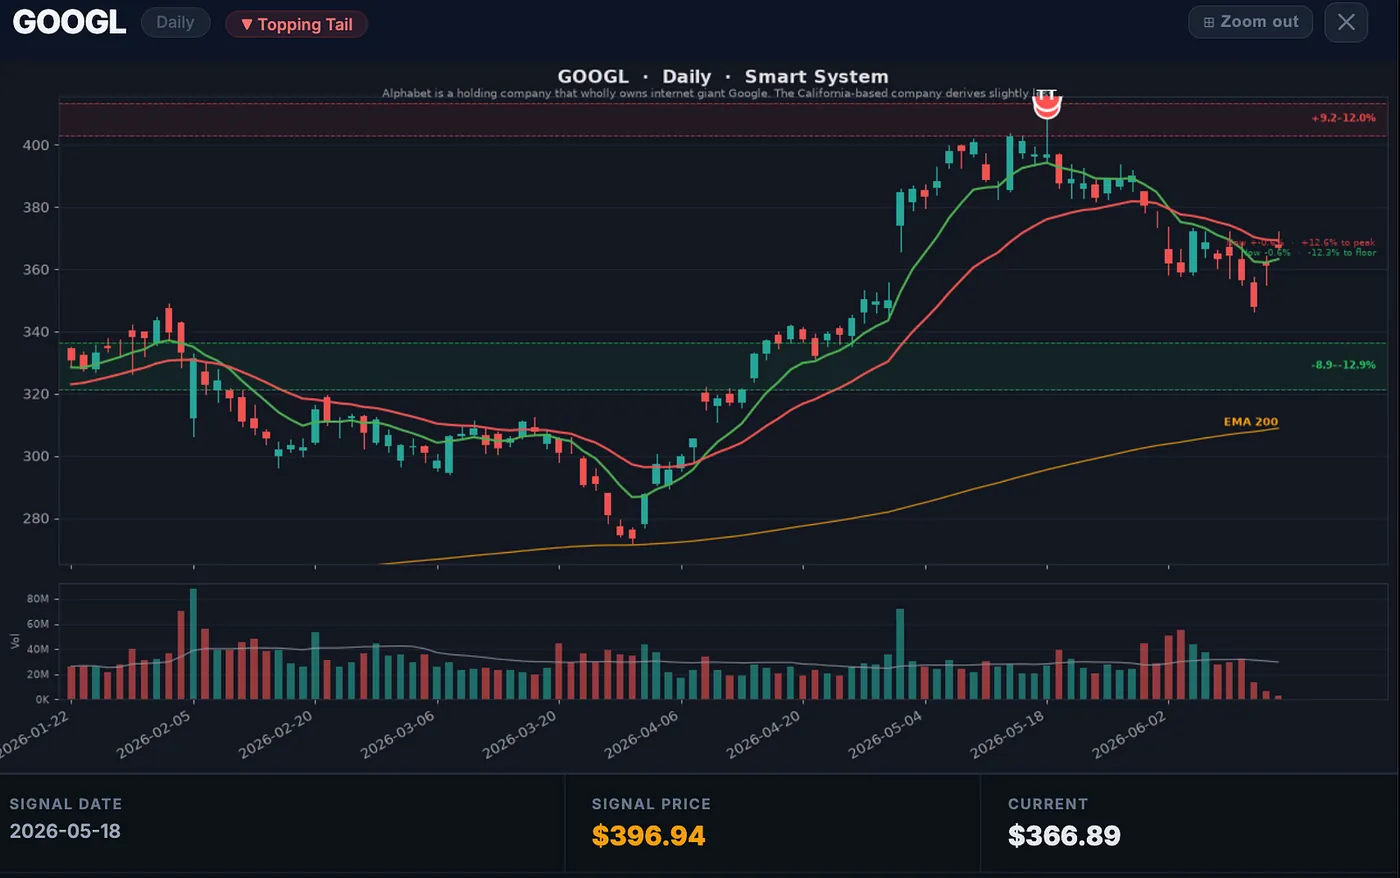
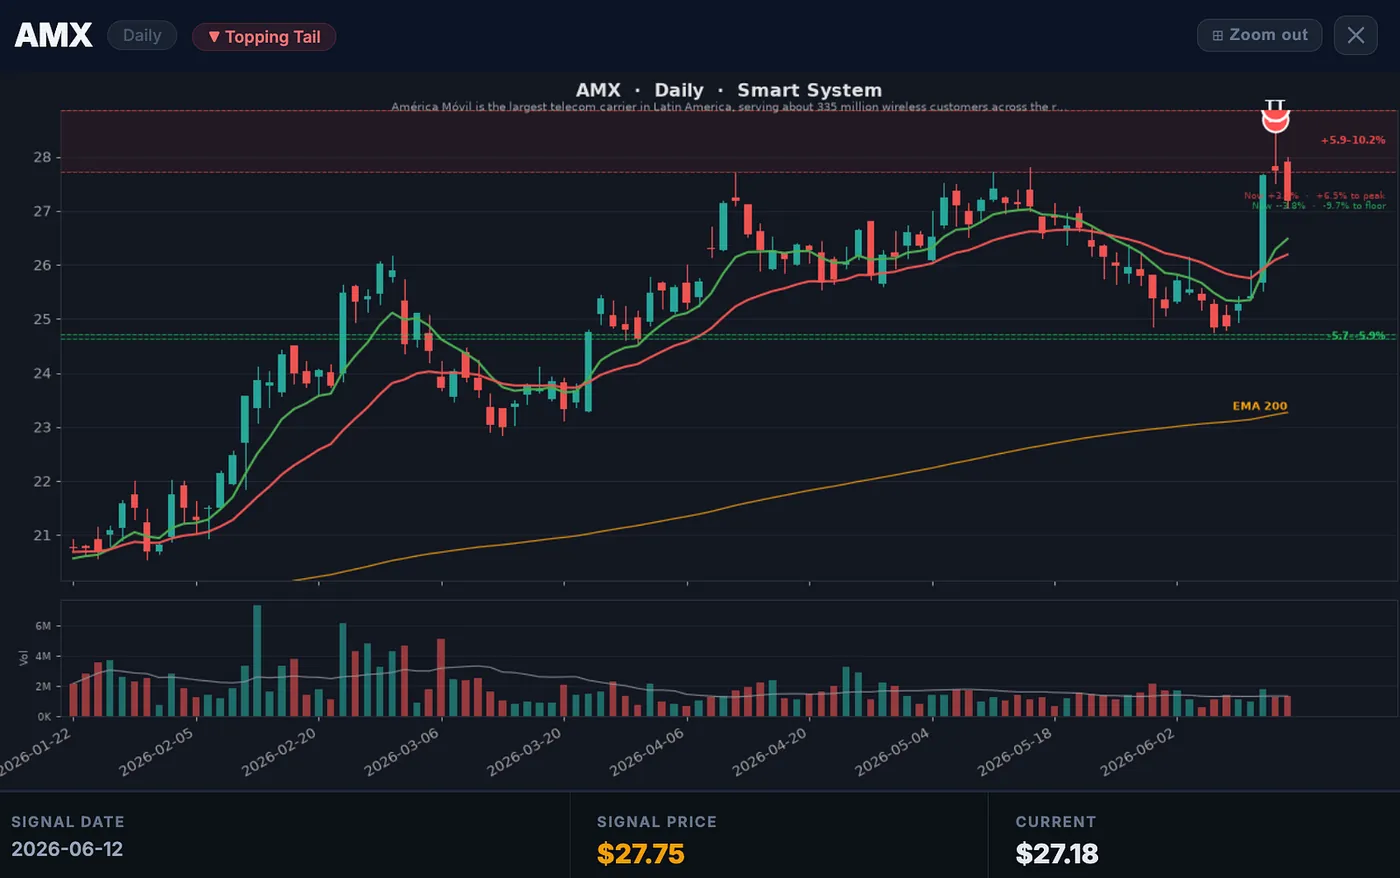
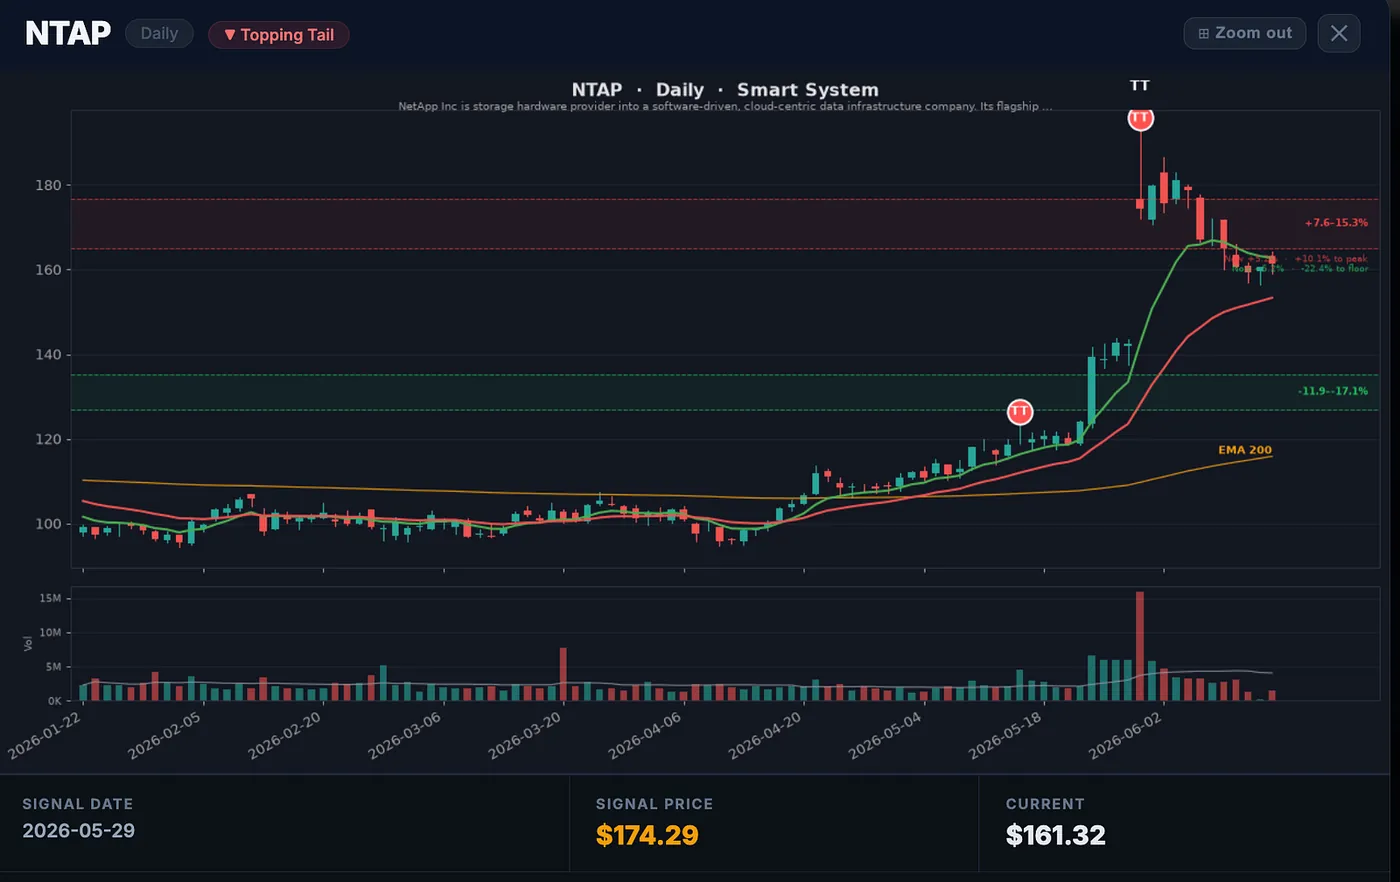
The inverse of a bottoming tail is topping tail.
These setups occur after a rally when strong selling pressure appears, creating a long upper wick that can signal a reversal.
Alphabet (GOOG)
Formed a topping tail near the $400 level and subsequently reversed lower.
América Móvil (AMX)
Recently printed a topping tail. The question now is whether sellers will follow through.
NetApp (NTAP)
Another recent topping tail setup that may be signaling a trend reversal.
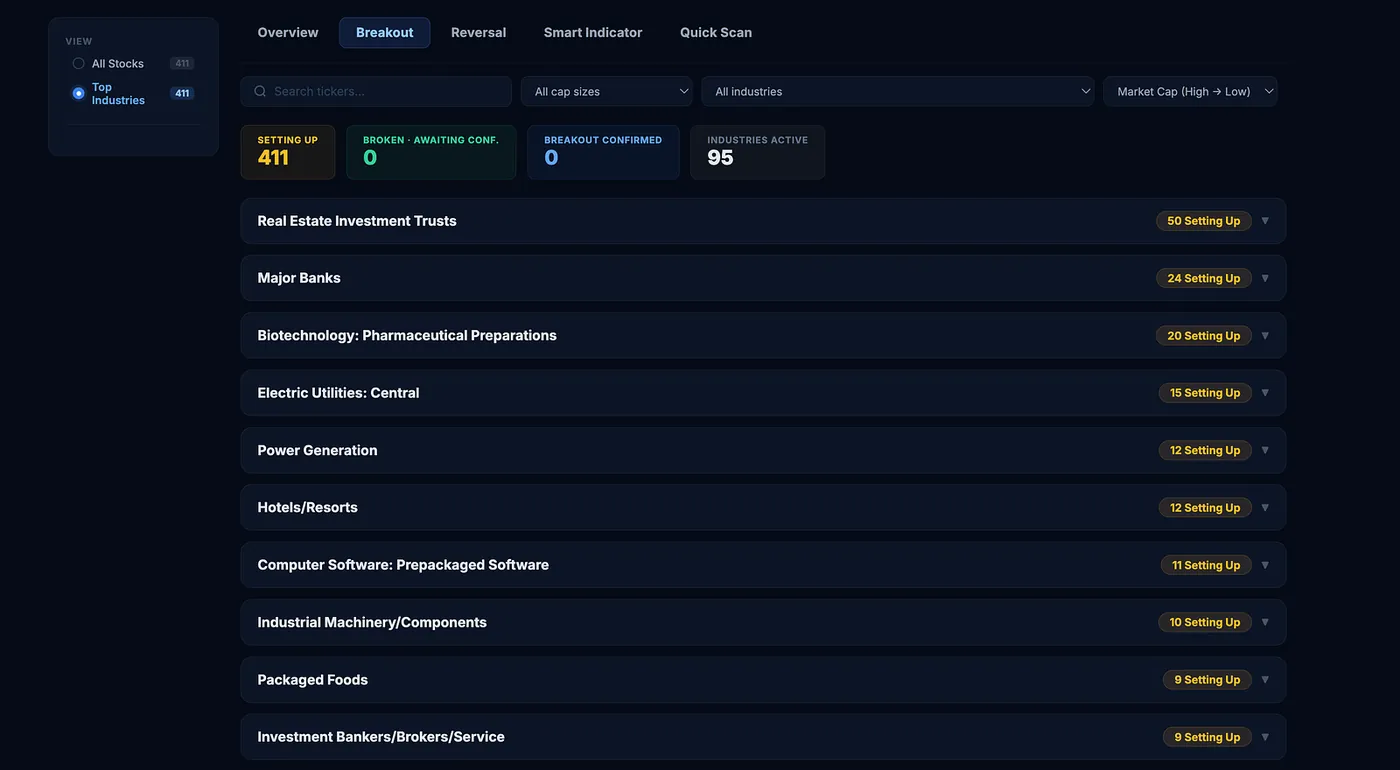
Breakout Progress Tracker
Want to stay ahead of the crowd?
This section dynamically tracks setups as they progress through different stages:
- Setting Up: Building a potential breakout pattern.
- Broken Out: Successfully moved above resistance.
- Confirmed: Breakout has held and gained follow-through.
The scanner also highlights sectors showing the strongest breakout activity, helping identify which market sector may be emerging AHEAD of the crowd and backed by data.
Final Thoughts
None of these setups are guarantees.
The purpose of the scanner is not to predict the future — it’s to filter through market noise and surface opportunities worth paying attention to.
Some setups will fail. That’s expected.
The objective is to think like a casino: maintain an edge, win more often than you lose, and let the probabilities compound over time.
I’m considering making this scanner available to others once it’s fully refined and battle-tested.
Would you be interested in using something like this ? If yes, joint the waitlist at datadriveninvesting.io/scanner.
And as always, if you find these insights valuable, please share this article with friends, family, and fellow traders. It helps me continue working toward my goal of making technical analysis more accessible, data-driven, and results-oriented.