From a $16.6K Loss to a $868 Gain — How Technical Analysis + Discipline Turned It Around.
By Harsh Shah · Updated
Disclaimer: This information is for educational purposes only and should not be considered financial advice.
I was down $16.6K. A massive, gut-punch loss.
Most would panic. Most would sell.
But discipline and technical analysis took the wheel.
The chart was changing. I adapted. I maneuvered, eyes open, zero emotion.
The result? A strategic flip.
That huge loss became a $868 gain.
Never underestimate the power of trusting your analysis.
My recent trade on OKLO stock is a case study in execution.
I’ll break down the entire process, starting with the technical analysis that drove my initial entry.
This trade perfectly illustrates how consistently following the charts — even when facing volatility — is the only way to lock out emotion.
I’ll show you exactly what I did at every turn, and how staying disciplined with my position size allowed the signals to guide me to a successful outcome.
Here is the full breakdown.
September 5th
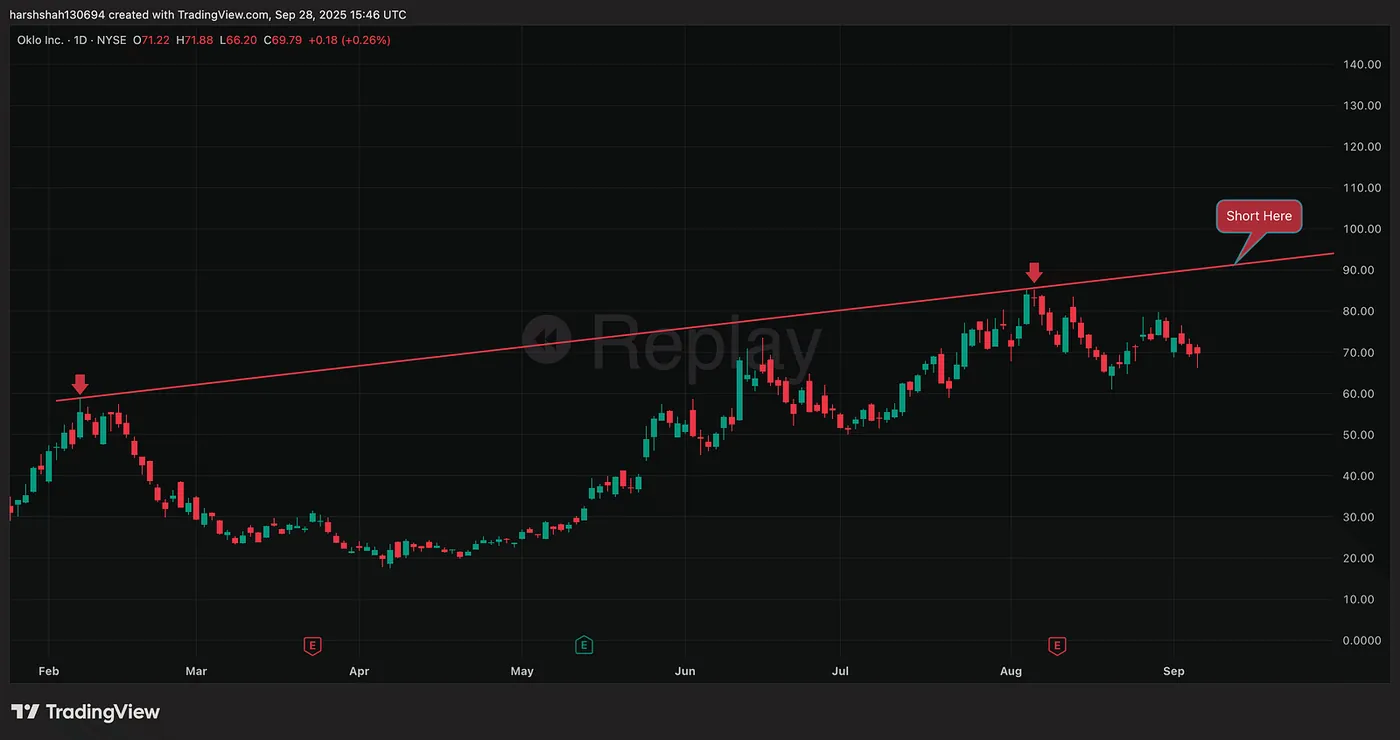
I flagged this stock for a potential short position in my watchlist.
My strategy was clear: I planned to enter the trade only if the price rallied up to the significant resistance level at $92.
September 15th
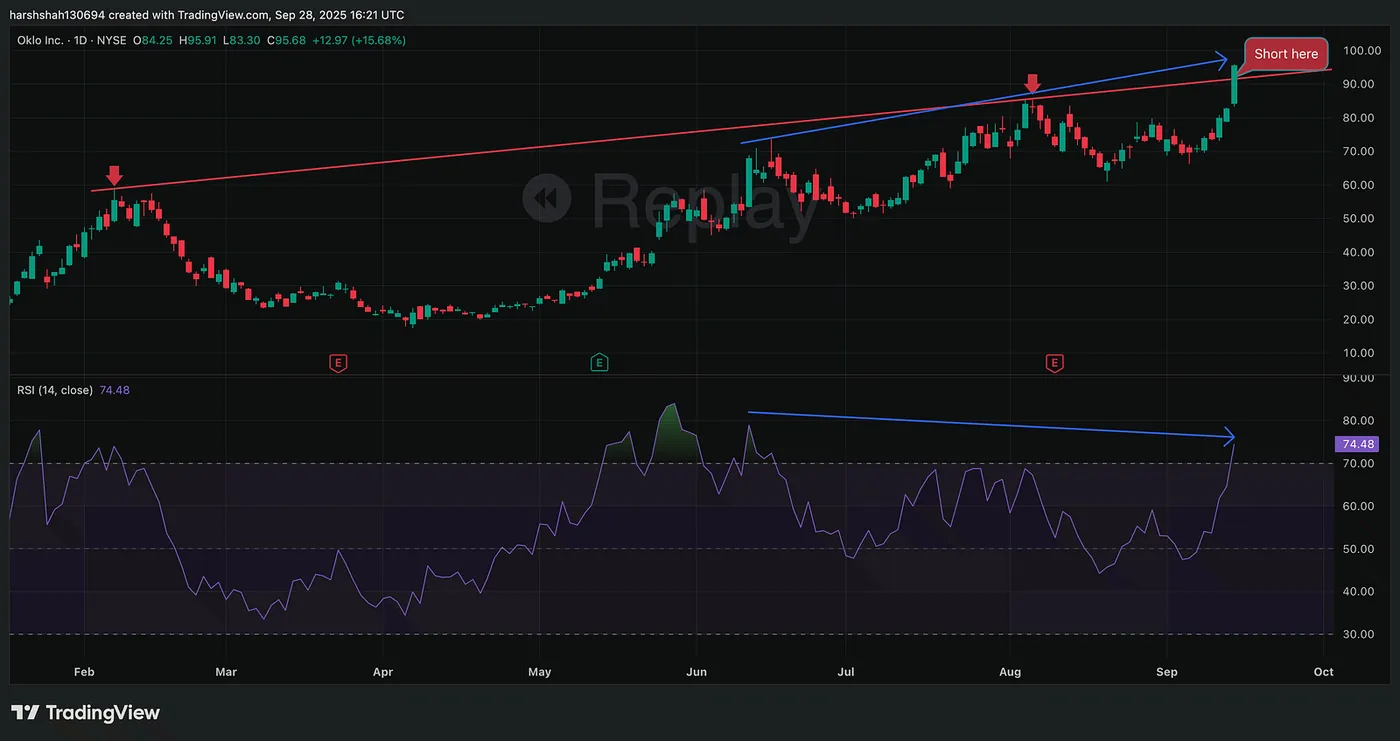
Exactly 10 days later (September 15th), the stock reached my planned short entry position. After a dramatic 40% rally into my target resistance zone, I executed my plan and initiated the short position.
Position size
Given how volatile this stock is — it can easily move 20–30% in a single day — I had to approach the entry with extreme caution.
My homework showed this stock is a ‘beast’, and in today’s crazy market, being protective when shorting is non-negotiable.
Therefore, I broke my position size into five parts, staging my entry instead of going all-in.
Also, I chose not to place a traditional stop loss; due to the volatility in this stock.
Instead, I planned to average into the position for every $10 increase in price.
September 22nd
In barely a week, the stock surged another 50% from the $93 mark (my entry point on September 15th). The volatility was extreme.
As expected, once the current level was breached, the price moved to and reached the next resistance line.
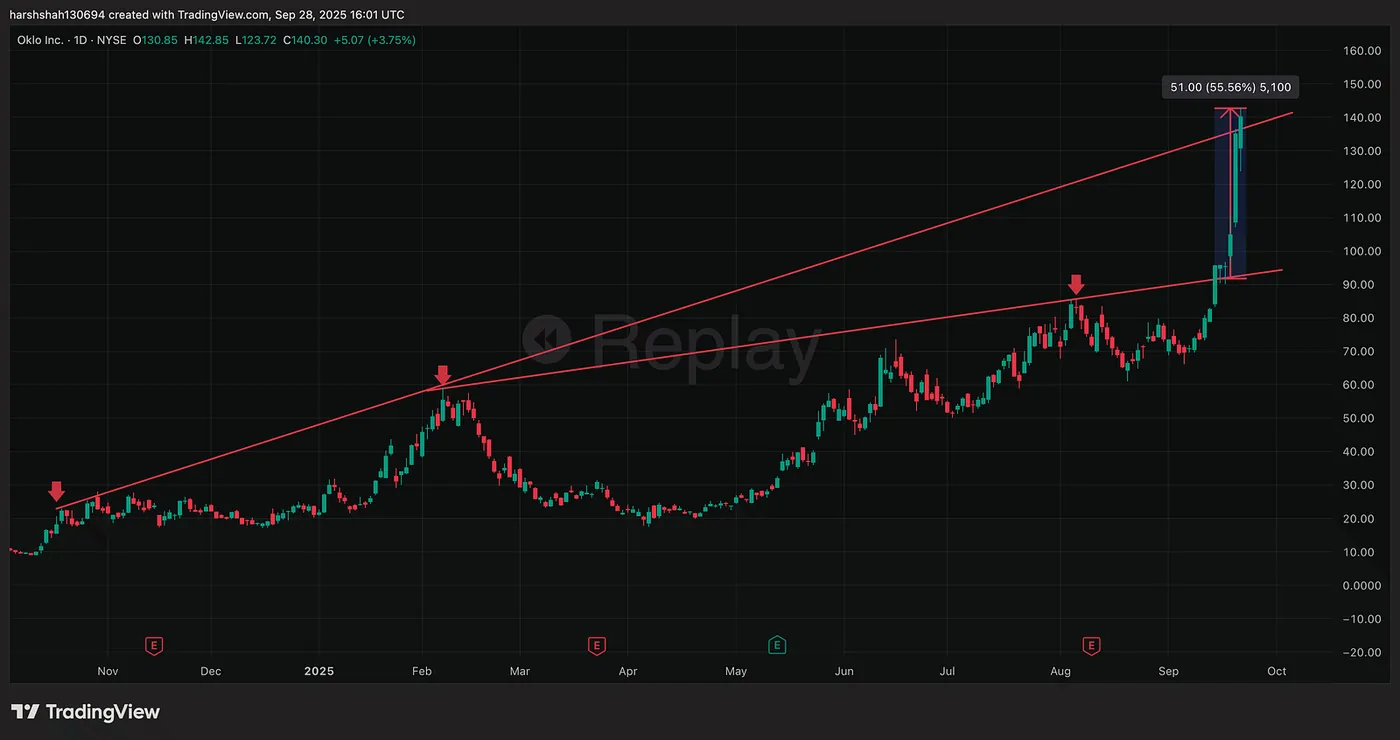
True to my pre-planned strategy, I continued to average into the short position, adding to my allocation with every $10 price increase.
The stock ultimately peaked near $143, pushing my trade to its limit (5 adds).
At that point, despite my average price sitting at a disciplined $112.75, I was holding a massive, unrealized loss of ~$16.6K.
September 26th
But there’s an iron rule in technical analysis: The faster you increase, the harder you fall.
And that is exactly what happened.
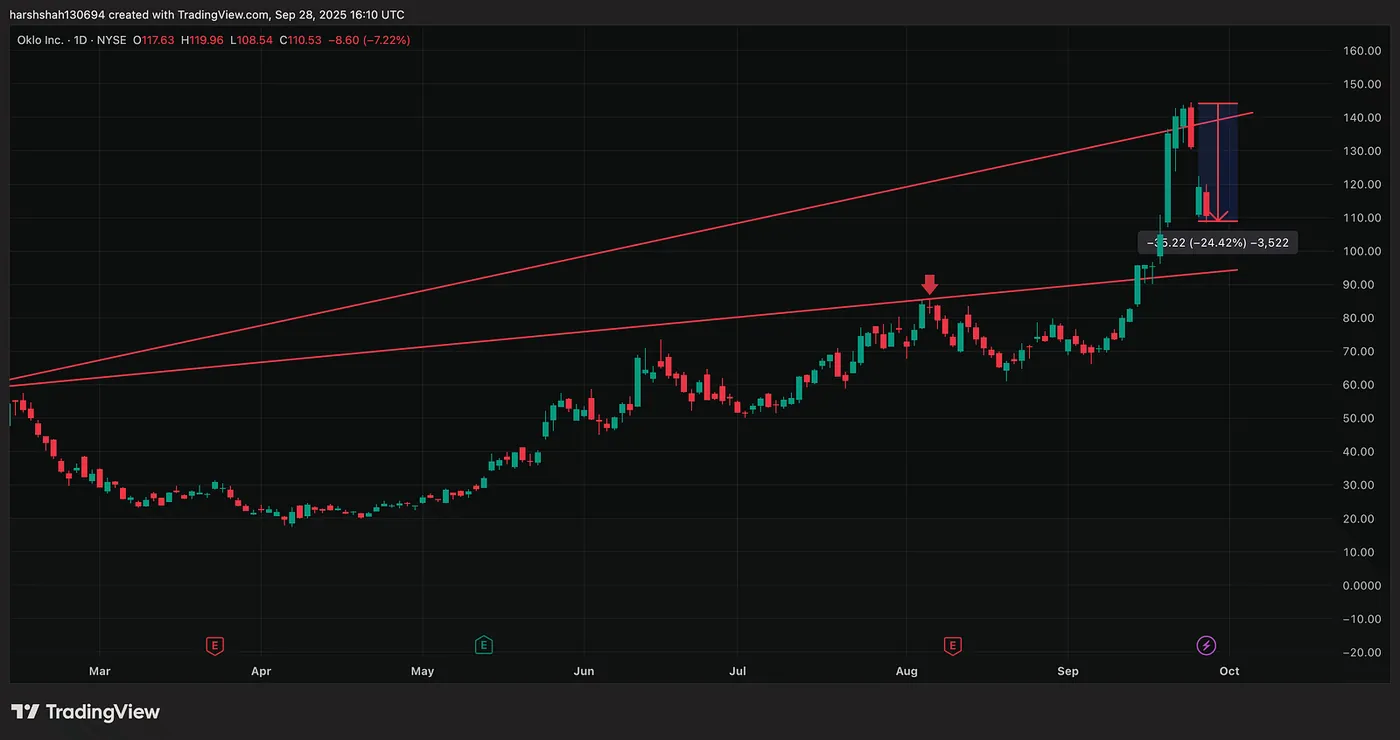
The price never confirmed about the resistance line and in the span of three days, this beast of a stock collapsed by a massive 24.62%, plunging to $108.7.
I covered my entire short position and closed the trade for a small gain of $868.
Trading Journal
So, what saved me from panic? — My trading journal.
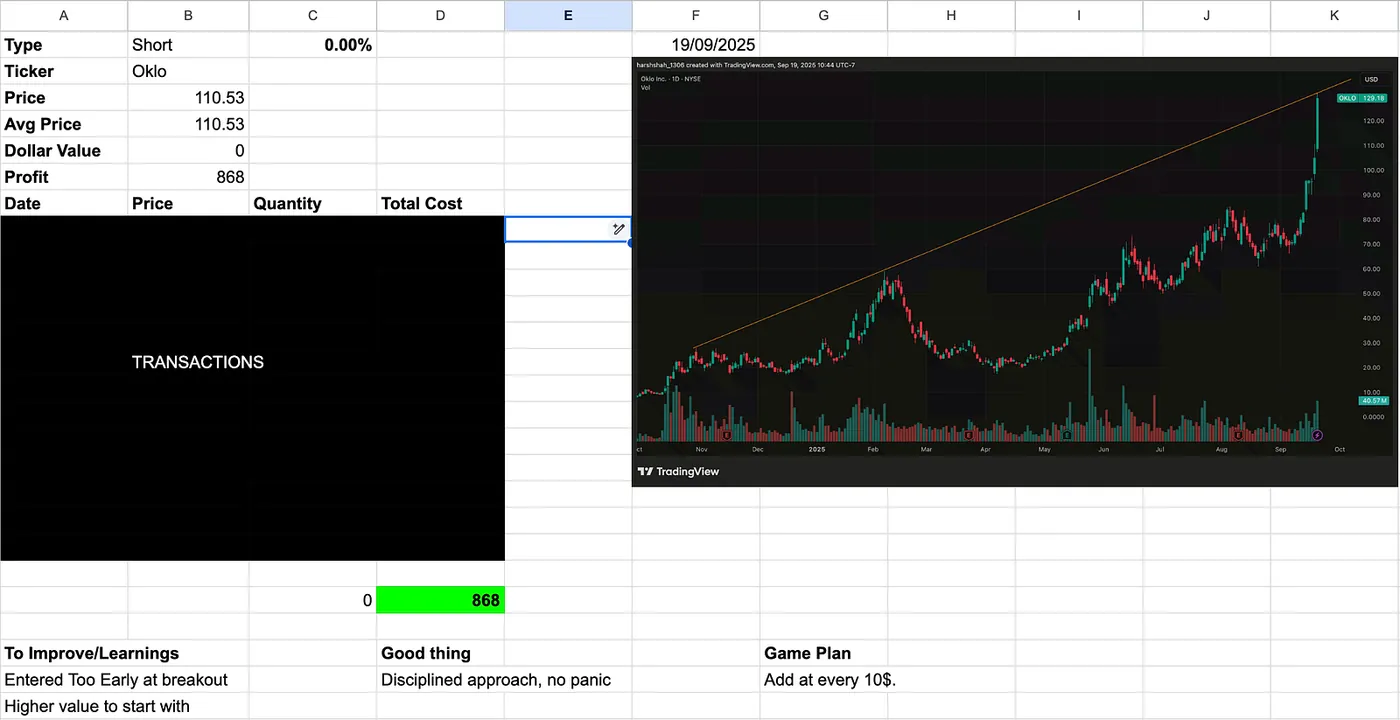
Before entering any trade, I meticulously record the entire plan. I include a screenshot of the chart.
When volatility hit and emotions threatened to take over……I simply opened that journal.
I reviewed the original reason for entry, the core strategy, and the commitment.
This pre-commitment kept me steady. No impulsive actions allowed.
Things that went well
- Technical analysis provided the key to precision, pinpointing the long-term resistance level for the initial entry timing.
- Prior in-depth study of the stock dictated a staggered entry strategy; instead of deploying capital all at once, I used a five-part, dollar-cost averaging approach.
- Continuous chart monitoring was crucial for adaptive planning. Once the immediate resistance was breached, the charts identified the next target level, prompting a critical reassessment of the strategy: whether to liquidate the position or maintain the hold.
- Maintaining a trading journal was instrumental in managing emotional risk, preventing any impulsive or panic-driven selling.
Should I have waited for a better entry ?
The question of whether the initial entry at the first resistance line was premature remains a compelling point for debate.
Could waiting for the next resistance level have been a better move?
Ultimately, this highlights a core truth in trading: no one can perfectly time the market.
The subsequent $93 to $143 surge (a 50% jump) was an outcome that no one could have predicted with certainty.
What if the price kept moving higher ?
As the price reached the second resistance level, my focus immediately sharpened, and I began closely monitoring the charts.
My stop was on any confirmed move above that resistance line.
While this would have triggered a substantial loss of $16.6k or more, having a clear confirmation signal allowed me to adhere strictly to the strategy, which ultimately proved successful.
Why did I decide to close all shorts ?
This is the key question. You might wonder if I should have held out for a complete collapse back to the former support levels.
My decision came down to one simple, rule-based question:
Would I initiate a new short position at $108.70 today?
=> The answer was a definitive No.
Squeezing out a few more dollars wasn’t worth the risk.
Instead, I choose to prioritize finding a fresh opportunity with a better probability.
If the charts reset and the price rallies back to the resistance, I will gladly re-analyze the technicals and consider a new entry.
CAT — a Potential Short Opportunity
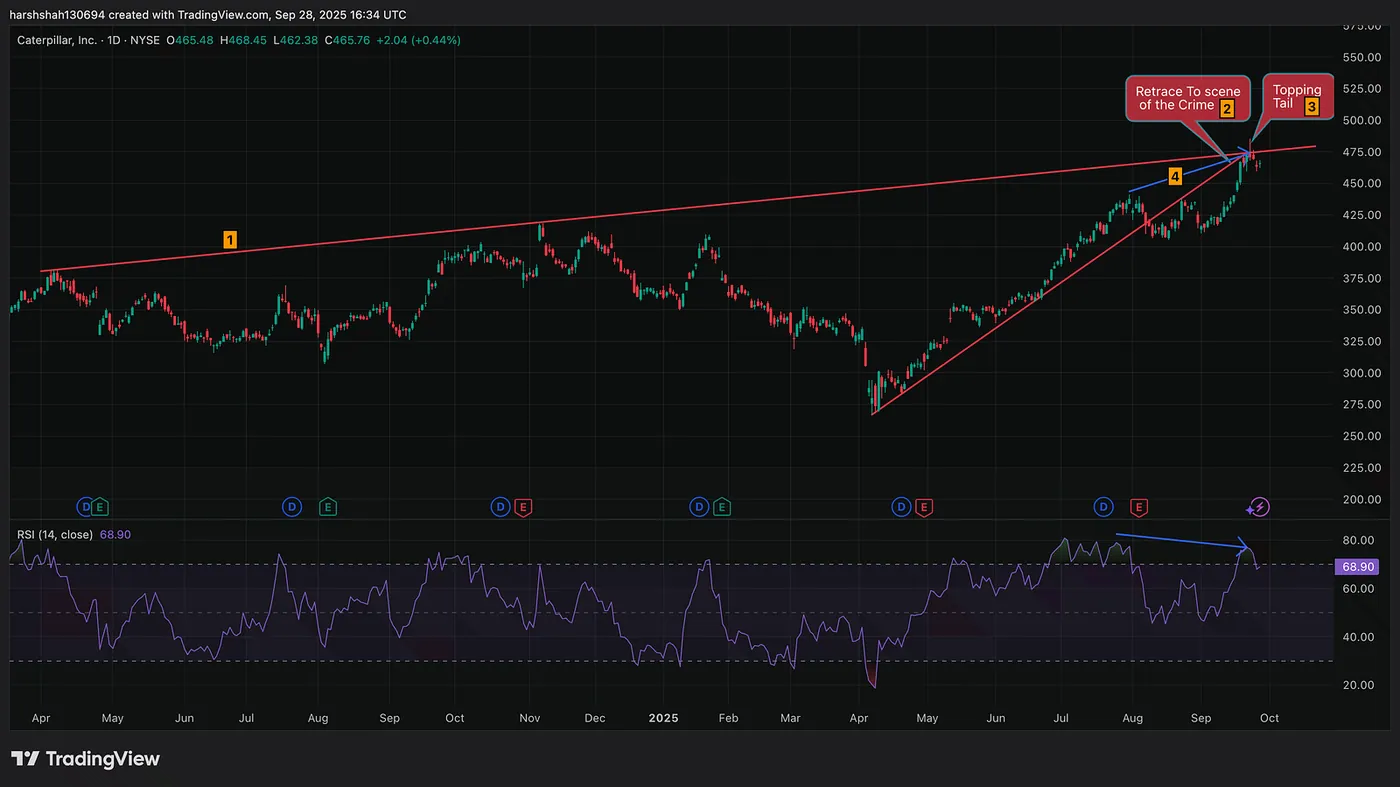
The technical setup on Caterpillar (CAT) is flashing a high-conviction signal, suggesting an 80%+ probability of a significant reversal. This bearish thesis is built on a four-factor technical alignment:
1. Long-Term Ceiling: The stock is directly challenging a major, long-term resistance level.
2. Trend Line Violation: Price action decisively broke the up-sloping trend line and, has retrace back to test it as resistance.
3. Candle Confirmation: A classic ‘Topping Tail’ candlestick pattern has printed right at the peak, signaling heavy selling pressure at the highs.
4. Momentum Shift: We have a clear RSI divergence, indicating that the buying momentum is fading despite the higher price.
This confluence of factors suggests a major shift is imminent. Let’s watch closely to see how this technical picture unfolds over the coming days and weeks.
Final Thoughts
This trade wasn’t about the size of the final profit; it was about the integrity of the process. It helped me to turn a $16,637 unrealized loss into a $868 realized gain by strictly adhering to a pre-defined plan.
That turnaround demonstrates the critical difference between gambling and trading: discipline and technical analysis are your armor against market fear.
I’m currently creating a technical analysis series to simplify investing for everyone. You can find the lessons published so farhere.