Roblox After a 49% Crash: A High-Probability Reversal Setup
By Harsh Shah · Updated
Disclaimer: This content is for educational purposes only and should not be considered financial advice.
Roblox has been brutally beaten down, dropping nearly 49% in just three months.
Right now, it looks like a classic falling knife.
And one hard lesson I’ve learned over the years is this:
If you’re going to try to catch a falling knife, you better have more than hope.
You need structure, confirmation, and multiple technical factors working in your favor.
Today, I want to break down a trade I’m personally in, why I entered it, and the psychology behind the decision — using pure technical analysis.
Let’s walk through it.
Before You Continue (Quick Context)
To fully follow this breakdown, it helps to understand:
Nothing fancy — just core TA concepts.
October 13, 2025 — When Technical Analysis Said “Sell”
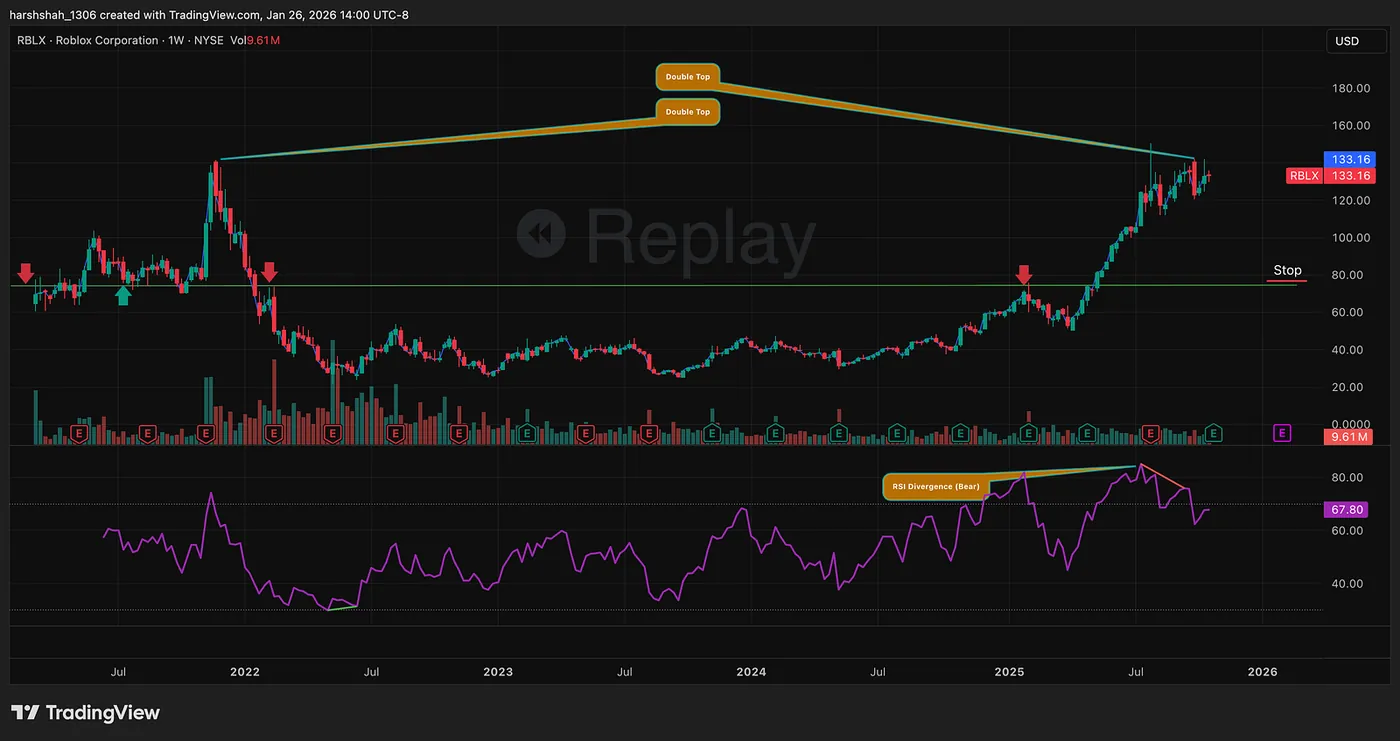
When Roblox was trading near $140, did I buy it?
Absolutely not.
Technical analysis was screaming sell.
On the weekly chart:
- A clear RSI bearish divergence was forming, Price was making higher highs, momentum wasn’t
- A classic double top structure appeared
What happened next wasn’t surprising.
The stock dropped 49%.
A professional trader didn’t “hope” here — they respected the chart. Some even profited on the way down.
After the Crash — Where Fear Peaks
Once a stock collapses, fear takes over:
- Should I buy now?
- What if it keeps falling?
This is where technical analysis becomes valuable — not for predicting bottoms, but for stacking probabilities.
After this 49% drop, I now see four technical factors aligning, pushing the odds meaningfully in favor of a bounce or reversal.
Jan 26th: The 4-Factor Setup I’m Watching
Here’s what changed:
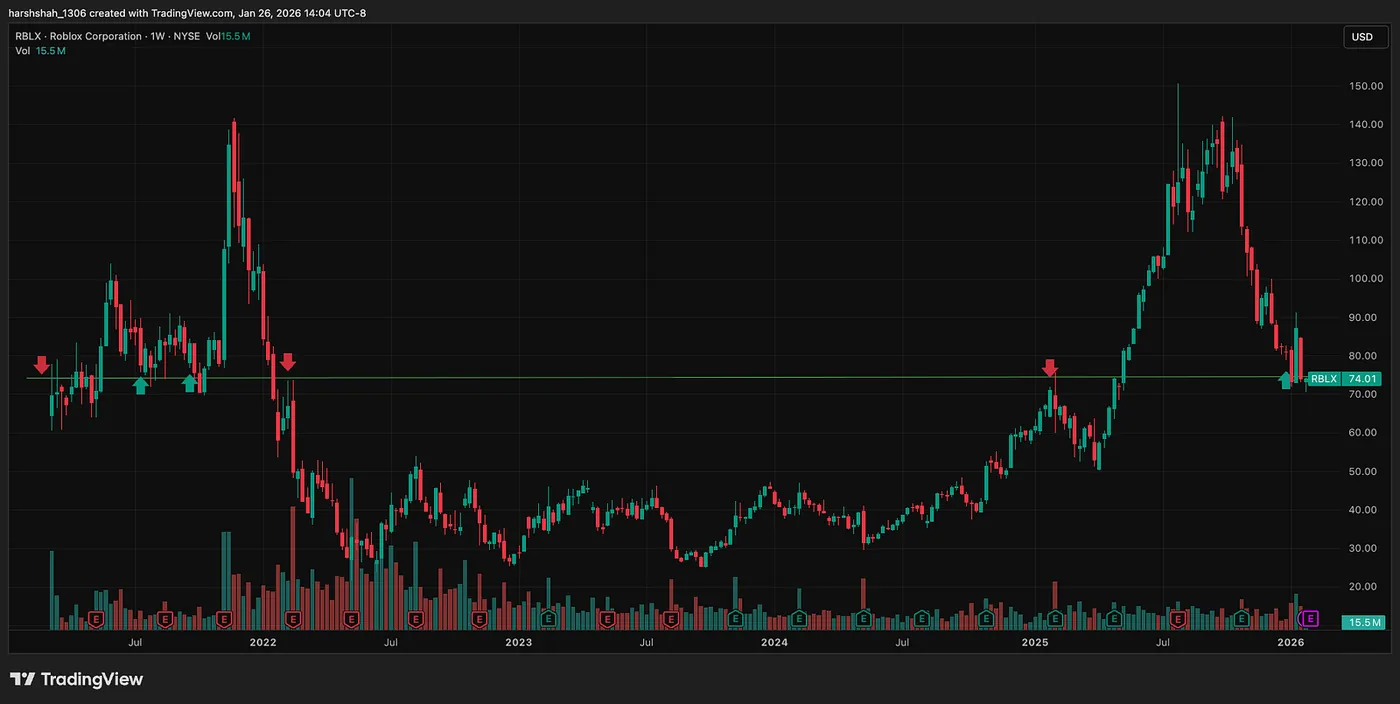
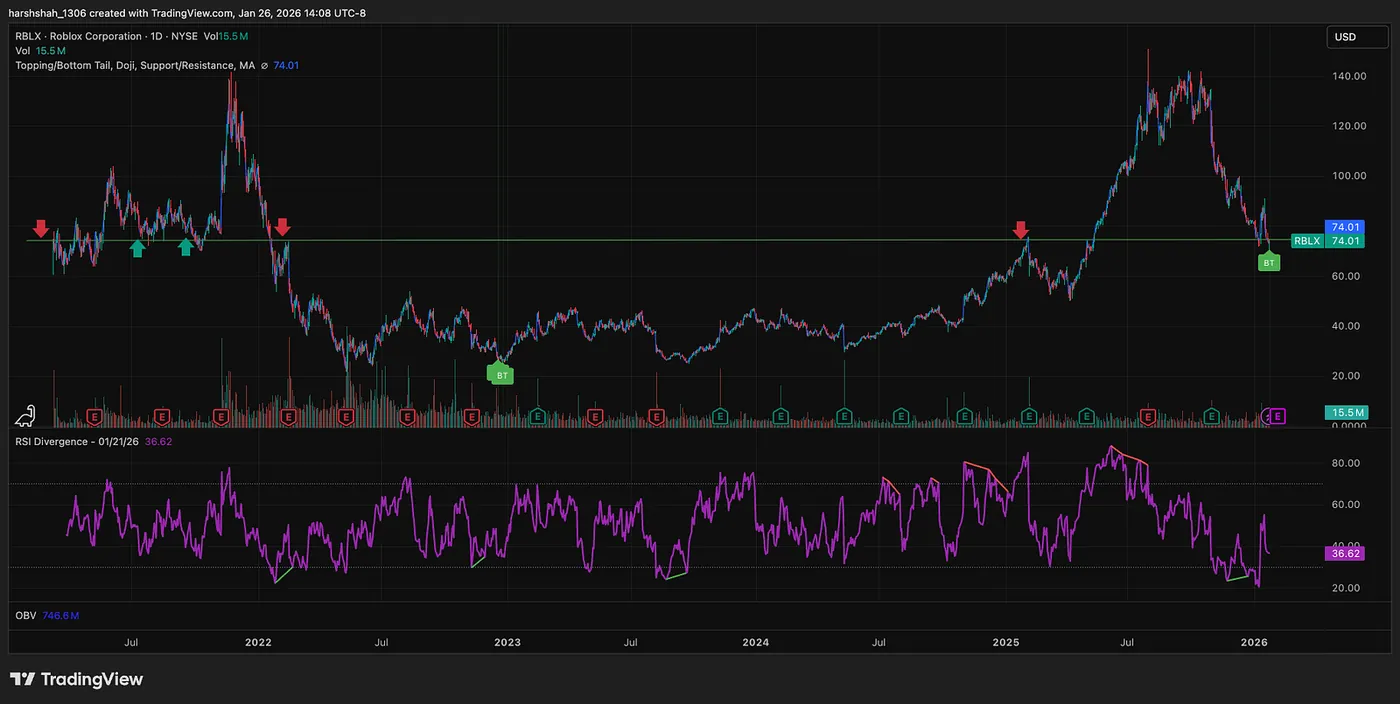
1️⃣ Long-Term Trendline Support (Weekly Chart)
Price is now testing a major trendline that has held multiple times in the past.
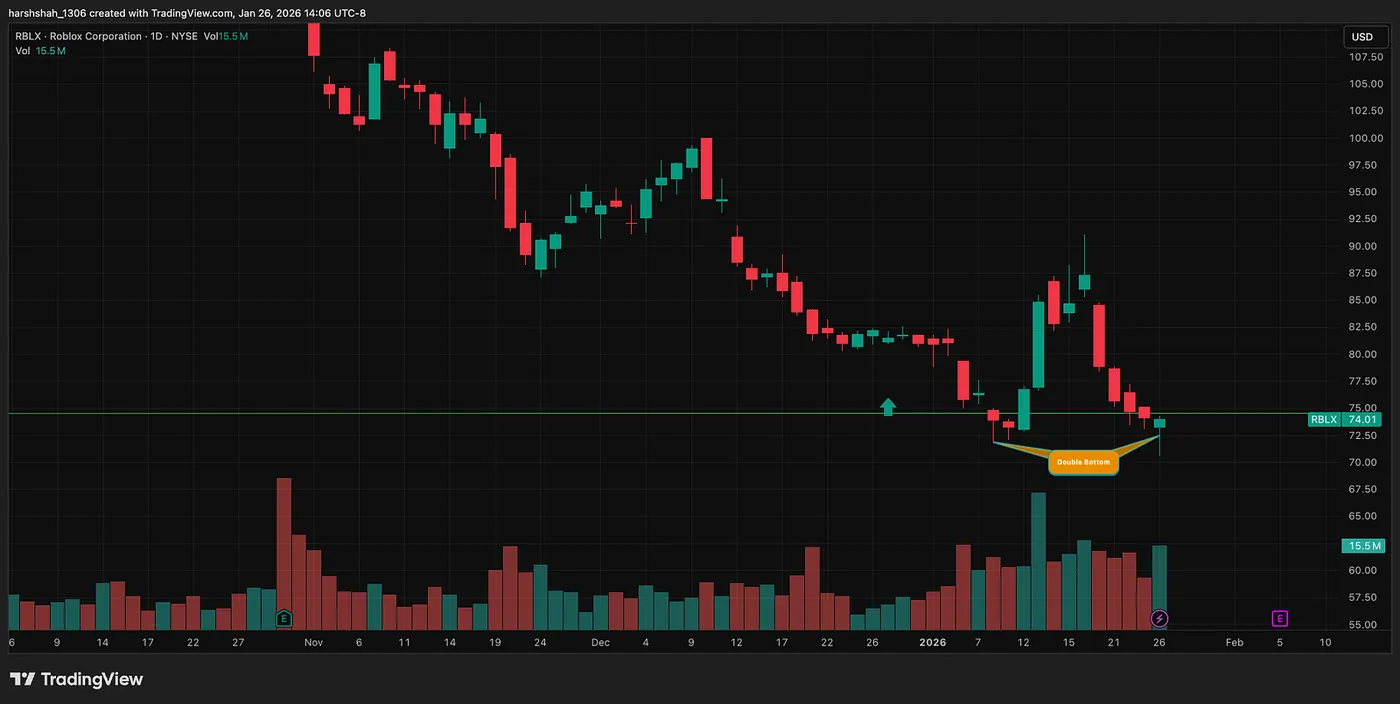
2️⃣ Double Bottom (Daily Chart)
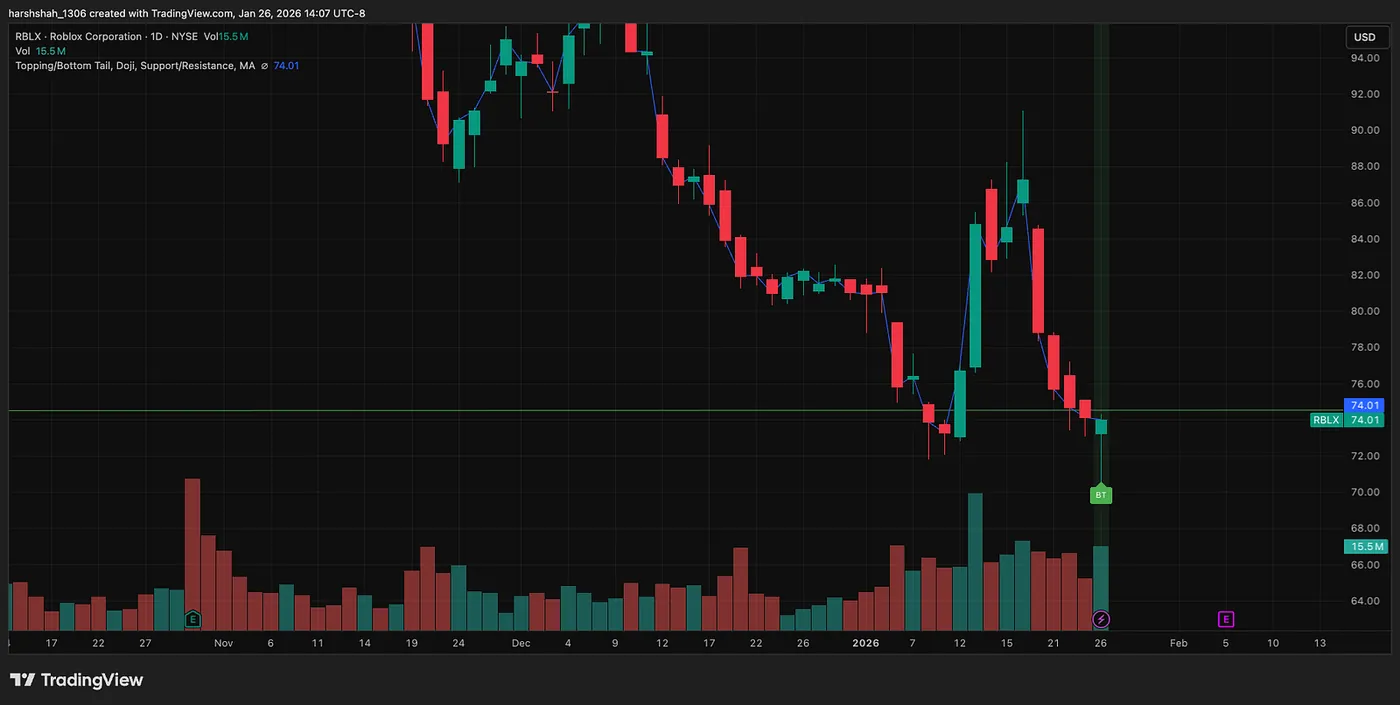
A short-term double bottom is forming, suggesting selling pressure may be exhausting.
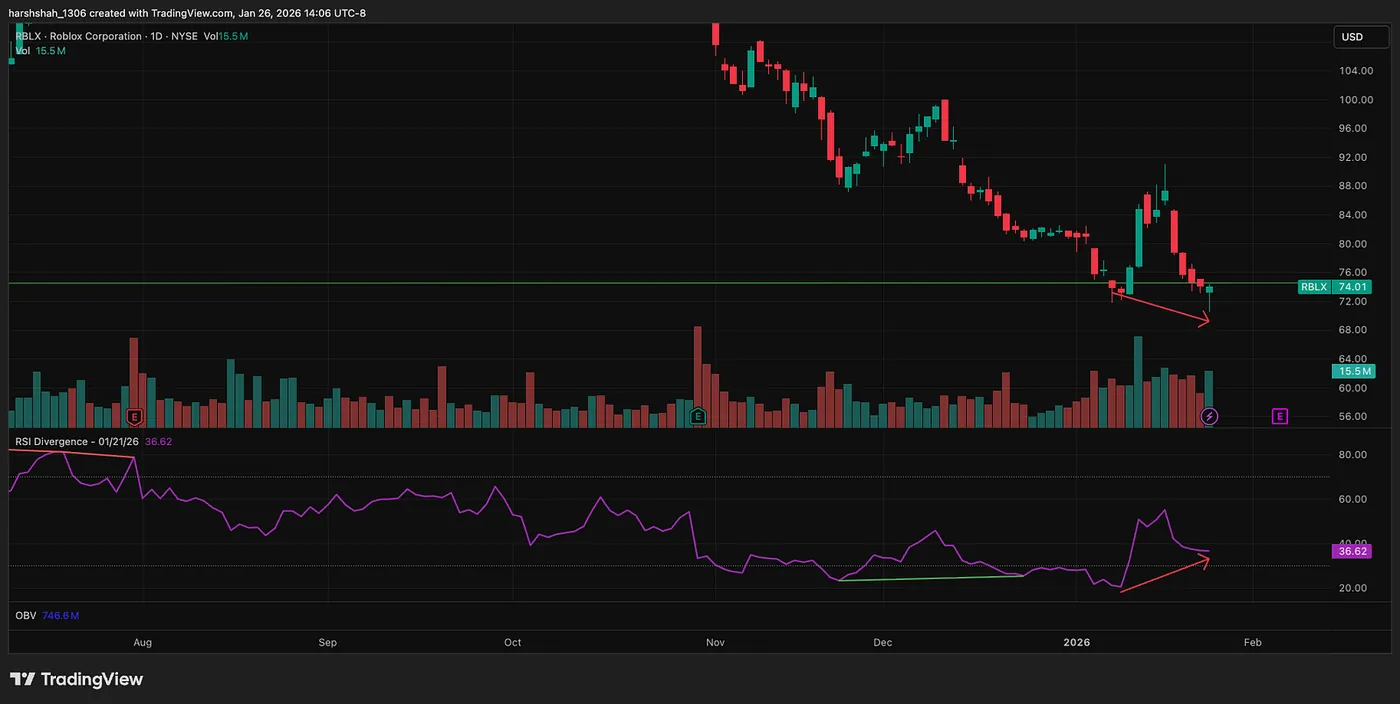
3️⃣ RSI Divergence
Momentum is improving while price made lower lows — a classic sign of downside weakening.
4️⃣ Bottoming Tail
Recent candles show long lower wicks, signaling buyers are stepping in aggressively at these levels.
Putting it all together
Individually, these signals are interesting, Together, they form a high-quality technical setup.
Important Reality Check
Technical analysis is probability, not certainty.
Even the best setups can fail if:
- Fundamentals deteriorate
- Macro news hits unexpectedly
- Price simply lacks follow-through
That’s why risk management matters more than being right.
Position size matters.
Stops matter.
And no setup is worth blowing up an account.
Still — from a pure technical perspective — this is one of the cleaner bottoming structures I’ve seen recently.
Final Thoughts
This trade isn’t about calling the exact bottom.
It’s about recognizing when:
- Fear is extreme
- Momentum is shifting
- And multiple technical factors align
That’s when odds start to tilt in your favor.
Catching reversals is hard.
Doing it without a plan is reckless.
But when structure, momentum, and price action come together — that’s when technical analysis truly shines.
Upcoming TA Course
If you want to learn how I apply this kind of technical analysis step by step, I’m building a complete Technical Analysis course.
In the course, I break down:
- Trading psychology and decision-making under pressure
- A step-by-step process to identify, enter, and manage trades
- How I plan trades before price moves
- Risk management frameworks that protect capital
- Journaling trades and reviewing mistakes
👉 You can join the early access list here: datadriveninvesting.io/course
If this article helped you think differently about trading, consider following — I write twice a week about practical investing minus noise.